

Abstract
Introduction: Gamma-aminobutyric acid (GABA) deficiency is suggested in depressive disorders, along with alterations in cortical excitability. However, whether these excitability changes are related to GABAA receptor availability is largely unknown. Our aim was to assess the correlation between these measures in depressed patients and healthy controls. Methods: Twenty-eight patients with a major depressive episode, measured before and after participating in a clinical trial with repetitive transcranial magnetic stimulation (TMS), and 15 controls underwent [11C]flumazenil positron emission tomography to assess GABAA receptor availability and paired pulse TMS (ppTMS) to evaluate cortical excitability. Both whole-brain voxel-wise GABAA receptor availability and mean values from left hand motor cortex and left paracentral lobule were correlated to the ppTMS outcomes: short-interval intracortical inhibition reflecting GABAA receptor activity, long-interval intracortical inhibition representing GABAB receptor activity, intracortical facilitation reflecting glutamate N-methyl-D-aspartate-receptor activity, as well as the resting motor threshold (rMT), considered a global measure of corticospinal excitability. Results: No significant differences in baseline GABAA receptor availability or cortical excitability were found between patients and controls. Additionally, no correlations were observed between baseline measurements of GABAA receptor availability and TMS outcomes. Changes in GABAA receptor availability in the hand motor cortex, between pre- and post-assessments, were inversely related to pre-post changes in hand rMT. Conclusion: We found that a change in GABAA receptor availability was inversely related to a change in rMT, suggesting a link between GABA deficiency and increased rMT previously observed in depressive episodes. The results highlight the complex mechanisms governing cortical excitability measures and offer new insight into their properties during the depressive state.
Introduction
Several hypotheses exist regarding the mechanisms underlying the pathophysiology of depressive episodes, including neurochemical, functional, and structural deficiencies [1]. Dysfunction in the transmission of gamma-aminobutyric acid (GABA), the major inhibitory neurotransmitter in the brain, has long been suggested in depressive episodes and is supported by accumulated findings in the last decades [2‒4]. Imbalance in glutamate, the primary excitatory neurotransmitter in the brain, has also been implicated in depressive episodes [1]. Glutamate and GABA share a complex relationship, not only because their opposing functions must maintain balance but also due to their shared synthesis pathway [3]. Moreover, structural changes in the hippocampus and prefrontal cortex have been observed in depressed patients. These alterations are believed to be related to neurotrophic factors, including a decrease in brain-derived neurotrophic factor [1]. In addition, diminished brain-derived neurotrophic factor levels lead to a reduction in the expression of several GABA-related genes, thus connecting the low neurotrophin hypothesis with the GABA deficit hypothesis of depression [5]. The role of GABA in depression is further supported by the observation that benzodiazepines, acting as positive allosteric modulators of the GABAA receptor, reduce the antidepressant effect of repetitive transcranial magnetic stimulation (TMS) [6].
Early research on the GABA deficiency hypothesis examined concentrations in plasma and cerebrospinal fluid. These studies discovered lower GABA levels in patients with unipolar depression compared with controls and reduced peripheral GABA concentrations in those with bipolar depression [7]. Similarly, studies examining GABAergic neuron-specific immunoreactive calcium-binding proteins in post-mortem tissue have displayed a decreased density of GABA interneurons in the prefrontal and occipital cortices of depressed patients [8, 9]. However, when examining glutamic acid decarboxylase, the enzyme that catalyses the production of GABA from glutamate and is almost exclusively found in GABAergic neurons, studies have shown mixed results, leaving the physiology of glutamic acid decarboxylase in depression still equivocal [3]. More recently, magnetic resonance spectroscopy (MRS) studies, which can more directly evaluate GABA concentrations in the brain, have largely supported the notion of lower GABA levels in depressed patients [10]. MRS studies have also found increased GABA levels in unipolar and bipolar depression after treatment with TMS [11‒13].
While many studies have reported reduced GABA concentrations in depressive episodes, much less is known about receptor availability. The GABAA receptor is considered to mediate the rapid phasic inhibitory synaptic transmission in the central nervous system [14]. In vivo GABAA receptor availability, assessed in a single photon emission computed tomography (SPECT) study using [123I]iomazenil, did not differ between depressed patients and healthy individuals [15]. Conversely, a study with [11C]flumazenil positron emission tomography (PET) found reduced binding to GABAA receptors in bilateral temporal cortices in patients with depression compared with healthy controls [16]. With SPECT, there are also findings of a widespread increase in cortical GABAA receptor binding in patients with depression after clinically successful electroconvulsive therapy [17]. However, a recent and relatively large multimodal study of GABA MRS and [11C]flumazenil PET, on the same patients as in this study, could not detect any difference between patients with depression and healthy controls [18].
Paired pulse transcranial magnetic stimulation (ppTMS) serves as a neurophysiological index of excitability within the motor cortex [19]. The modulatory effect of a conditioning pulse that precedes the test pulse can be evaluated by measuring the decrease or increase of a motor evoked potential (MEP) compared with an unconditioned MEP (ucMEP). By adjusting the timing and intensity of the pulses, various cortical circuits can be examined [19]. The resting motor threshold (rMT), which refers to the lowest TMS pulse intensity needed to elicit a minimal MEP in a relaxed target muscle, also provides information on the excitability of the motor cortex [20]. A recent meta-analysis noted hemispheric asymmetry in rMT, with higher rMT in the left brain hemisphere than the right in patients with depression, while the opposite was found in healthy individuals [21]. A study that focused on rMT in the left hemisphere found that it was significantly higher in patients with treatment-resistant depression compared with unmedicated patients with depression, medicated euthymic patients with depression, and healthy individuals [22]. Another study reported higher rMT in melancholic than undifferentiated depression, but no significant hemispheric asymmetry was observed [23].
Short-interval intracortical inhibition (SICI) is a ppTMS measure that reflects GABAA receptor-mediated activity. Long-interval intracortical inhibition (LICI) and cortical silent period both represent GABAB receptor-mediated activity. Intracortical facilitation (ICF), on the other hand, reflects excitatory glutamate N-methyl-D-aspartate (NMDA) receptor-mediated activity [19]. A recent meta-analysis on ppTMS measures in patients with depression compared with healthy controls concluded that depression correlated with decreased SICI and cortical silent period, as well as a slight increase in ICF [24]. LICI was not included in the meta-analysis, but one study has found impaired LICI in depressed adolescents with suicidal behaviour compared with depressed adolescents without suicidality and healthy controls [24, 25].
While these ppTMS findings could be consistent with reduced GABAA receptor availability in depressive episodes, the relationship between availability of GABAA receptors and excitability in the motor cortex is largely unknown. The only previous study addressing this topic, which focused on differences in GABA neurotransmission during normal ageing, could not demonstrate any association between SICI and GABAA receptor availability in the motor cortex measured with [11C]flumazenil PET [26]. However, no study has assessed this relationship in patients with depression to date.
The aim of this study was to assess the relationship between two types of measures of the GABA system; GABAA receptor availability determined through [11C]flumazenil PET and cortical excitability measured using TMS, in patients with an ongoing major depressive episode and in healthy controls. In addition to correlation of baseline measurements, we also analysed if changes in GABAA receptor availability between pre- and post-assessments were correlated to pre-post alterations in motor cortical excitability, measured over 4 weeks during which the patients participated in a clinical sham-controlled TMS treatment study. These additional analyses aimed to reduce the impact of MEP variability across subjects, which may otherwise impede analyses of TMS [27]. Lastly, we sought to determine if the relationship between cortical excitability and GABAA receptor availability differed between depressed patients and healthy controls.
Methods
Participants
A group of 28 patients with depression was recruited from a psychiatric clinic at Uppsala University Hospital. In addition, 15 healthy volunteers were enlisted through advertising. The inclusion criteria included an age range of 18–59 years, and for patients, an ongoing bipolar or unipolar major depressive episode verified with Mini International Neuropsychiatric Interview (M.I.N.I.) (Swedish translation of version 6.0.0), unchanged psychiatric medication the preceding month, and a score of ≤40 points on the Motivation and Pleasure Scale-Self-Report [28, 29]. Exclusion criteria for all participants consisted of epilepsy, ferromagnetic and other metal implants, benzodiazepine treatment, substance use disorder (except for nicotine and caffeine), and pregnancy. All participants provided written informed consent for their participation. The study was approved by the Research Ethical Review Board in Uppsala and conducted in accordance with the Helsinki Declaration.
Rating Scales
The patients were assessed for treatment resistance upon inclusion, using the Maudsley Staging Method for treatment resistance in depression. The model involves three factors rated by a clinician: episode duration, episode severity, and treatment failures. The resulting total score ranges from 3 to 15, with higher score indicating increased treatment resistance [30].
All participants completed the self-assessment version of Montgomery-Åsberg Depression Rating Scale. This nine-item scale ask individuals to rate symptom severity on each item from 0 to 6, resulting in a total score between 0 and 54; higher scores denote increased depression severity [31].
Experimental Design and Procedure
The patients underwent magnetic resonance imaging (MRI), PET, and ppTMS before and after participating in a sham-controlled, double-blind clinical trial of intermittent theta burst TMS over the dorsomedial prefrontal cortex. The intervention occurred twice daily over 10–15 consecutive weekdays, as detailed elsewhere [32]. Consequently, the patient group in this study consisted of participants who received either active or sham treatment.
Assessments (MRI, PET, and ppTMS) were conducted on the same day, one weekday before treatment onset and again 4 weeks later. The healthy controls only participated in baseline assessments.
TMS Resting Motor Threshold and Paired Pulse Measurements
TMS measurements were performed with a Cool D-B80 coil (MagVenture) and MagPro X100 stimulator (MagVenture, Farum, Denmark). The coil was held with the handle rotated 45° to the midsagittal line during stimulation.
The rMT was measured for both hand and foot. For hand rMT, motor-evoked potentials were measured (Dual Bio Amp, ADInstruments, Sydney, Australia) from the right musculus interosseous dorsalis I using surface electromyography (EMG) electrodes (Ambu, Copenhagen, Denmark). The EMG filter bandwidth was 10–1,000 Hz. The EMG signal was recorded and digitized (sampling rate 4 k/s) with PowerLab 4/35 (ADInstruments, Sydney, Australia), and stored and analysed with the software LabChart 8 (ADInstruments, Sydney, Australia). For foot rMT, lower leg muscle response to motor cortex stimulation was assessed by visual observation of uni- or bilateral twitches of the feet.
The hand rMT “hot spot” was defined as the scalp location where TMS generated the largest MEP responses from the musculus interosseous dorsalis I. The hand rMT hot spot was located by starting 1 cm anterior and 5 cm lateral (left) of the skull vertex, then measuring the MEP response in a grid of 1 cm squares. The skull vertex was determined as 50% of the nasion-inion distance and 50% of the distance between the outer ear helix roots. For foot rMT, the “hot spot” was defined as the stimulus location that resulted in the strongest visually assessed twitch of the feet. The foot rMT “hot spot” was located by starting 2.3 cm anterior of the skull vertex, then assessing the magnitude of visual twitching in both feet in a grid of 1 cm squares, with maximum lateral deviation from the midsagittal line of 1 cm.
After locating the hot spot, the individual motor threshold was determined by using the freeware TMS Motor Threshold Assessment Tool (MTAT 2.0) [33, 34]. For hand rMT, 0.1 mV was set as the minimal amplitude for a MEP response. For foot rMT, a positive visual twitching of either foot was considered a positive response. Motor threshold was defined as percentage of maximum machine output.
PpTMS was only performed based on MEP responses from musculus interosseous dorsalis I (hand area). The protocol for ppTMS was divided into four parts each consisting of 10 stimulation trials, starting with ten single pulse stimuli for ucMEPs followed by ten paired pulse stimuli for each of SICI, ICF, and LICI indices.
Stimulus intensity for ucMEP was 120% of rMT. For SICI and ICF variables, conditioning stimulus intensity was 80%, and test pulse intensity was 120% of rMT, whereas for LICI both pulses were 120% of rMT. Interstimulus intervals for the three ppTMS variables were 3 ms for SICI, 12 ms for ICF, and 100 ms for LICI.
After data acquisition, automated MEP peak-to-peak values with amplitudes ≥0.1 mV were collected, and all charts were checked visually for false MEP registrations due to baseline drift or high background noise. In recordings with a high level of background noise, typically in the form of 50 Hz sine wave artefacts, each MEP amplitude peak-to-peak was measured directly in the LabChart software. The average peak-to-peak MEP for each measurement was calculated. SICI, ICF, and LICI were defined as ratios of the average of ten conditioned MEPs (SICI, ICF, or LICI) divided by the average of ten initial ucMEPs and ten ucMEPs acquired from the conditioning pulses in the LICI protocol.
Magnetic Resonance Imaging
T1-weighed structural images were acquired with a 3 Tesla scanner (Achieva dStream, Philips Healthcare, Best, The Netherlands) and 32-channel head coil using a 3D turbo FFE sequence (TR/TE = 8.2/3.8 ms, flip angle = 8°, field of view = 256 × 256 mm2, and spatial resolution = 1 × 1 × 1 mm3).
Positron Emission Tomography
The PET investigations were performed on a Discovery MI PET/computed tomography system (GE Healthcare, Waukesha, WI). A low-dose computed tomography attenuation correction image was acquired (120 kV, 10–20 mA, noise index 170). [11C]flumazenil is a well-established tracer that labels GABAA receptors by binding to the benzodiazepine-binding site of the receptor, thus enabling the quantification of the GABAA receptor. The participants received an intravenous injection of [11C]flumazenil (2–4 MBq/kg body weight) at the start of the dynamic PET acquisition (4 × 15 s, 4 × 60 s, 2 × 150 s, 2 × 300 s, 2 × 600 s, totalling 40 min) [35]. Reconstruction of PET images used time-of-flight ordered subsets expectation maximisation with 3 iterations and 34 subsets, including resolution recovery, and a 3-mm Gaussian post-processing filter. The [11C]flumazenil synthesis was conducted as previously described [35].
PET and MRI Processing
Correction of within-scan movement for all dynamic PET frames was done with VOIager 4.0.7 (GE Healthcare) software. After co-registration of the T1-weighed MRI images to a summation over the first 5 min of the PET scan, using Statistical Parametric Mapping 8 (SPM8; Wellcome Trust Centre for Neuroimaging Institute of Neurology, University College of London, UK), the image was segmented into grey and white matter. A basis function implementation of the simplified reference tissue method was used to obtain parametric images of non-displaceable binding potential (BPND) [36‒38]. For reference region, the cranial half of the subjects’ white matter segmentation images, with the two outer layers of voxels removed by global erosion, was selected. This resulted in a centrum semiovale reference region with an average volume of 4.4 ± 1.4 cm3 across subjects. The reference tissue time-activity curve was generated by projecting the reference region over all frames of the dynamic PET scan.
Further image pre-processing was conducted in SPM12 in MATLAB 2019b with co-registration of the BPND images to the T1-weighed image. Tissue classification, bias correction, and spatial normalization of the T1-weighted images were performed using the unified segmentation algorithm as implemented in SPM12. The resulting deformation fields were used to transform the individual T1-weighed and BPND images into Montreal Neurological Institute (MNI) space. The BPND images were smoothed with a kernel with a full width at half maximum of 8 × 8 × 8 mm3.
Volumes of Interest
The primary volume of interest for BPND was the region in the motor cortex where TMS was applied. As an estimation for this region, the peak coordinates within the left hemisphere from an activation likelihood estimation meta-analysis of voluntary finger tapping studies were used [39]. Voluntary finger tapping seems to activate the same motor cortex area as finger tapping induced by TMS pulses, hence the same area being stimulated in TMS [40].
The peak coordinates identified above, −38, −24, 56 in MNI standard space, were located within the precentral sulcus [39]. A mask was defined as a sphere of 1 cm radius around these coordinates, further referred to as M1 sphere (Fig. 1).
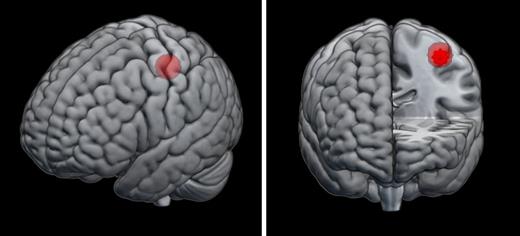
Inverse deformation fields from the above pre-processing were applied to transform the M1 sphere into subject space of each participant at each time point, enabling extraction of individual mean BPND within the M1 sphere. In addition, the individual distance between the scalp and cortical surface over the M1 sphere was calculated in order to account for this when assessing the relationship between BPND and rMT, since this is known to influence rMT in addition to cortical excitability [41]. This was achieved by finding the closest voxel within the scalp segmentation to the M1 sphere in subject space, then calculating the Euclidean distance between that voxel and the nearest grey segmentation voxel.
Additional volume of interest was the left paracentral lobule, which is the cortex area targeted when measuring the foot motor threshold with TMS. A mask for that region was defined using the automated anatomical labelling atlas and used for extracting the mean BPND for each participant in the same manner as for the M1 sphere [42].
Statistical Methods
Descriptive data were tabulated using medians and interquartile ranges, as all data was either ordinal or not normally distributed. Group differences were analysed with χ2 test and Mann-Whitney U test.
Spearman’s rho was employed for assessing correlations between mean [11C]flumazenil BPND in the volumes of interest and TMS measurements of cortical excitability, both for the entire sample and separately in patients and healthy controls. BPND in the M1 sphere was correlated with SICI, LICI, ICF, and hand rMT. Hand rMT was adjusted for individual scalp-to-cortex distances. Additionally, BPND in the paracentral lobule was correlated with foot rMT. In the patient group, we examined whether changes in binding potential in the M1 sphere between pre- and post-assessments correlated with pre-post changes in SICI, LICI, ICF, and hand rMT following (sham or active) treatment. The analyses were conducted in JASP 0.14.1, with significance level α < 0.05. Correction for multiple comparisons was made using the Holm-Bonferroni method.
To perform whole-brain voxel-wise regression analyses between BPND and TMS outcomes, the parametric PET images were entered in a voxel-wise general linear model in SPM, with the TMS outcomes serving as regressors in separate analyses. Hand rMT was adjusted for the scalp-to-cortex distance. In the patient group, voxel-wise correlations of pre-post changes were also analysed using PET images composed of the differences in BPND between the pre- and post-assessment parametric PET images and pre-post changes in TMS outcomes. F-contrasts were defined to assess voxels where BPND was related to the TMS outcome. Voxels were considered significant at a cluster threshold of pFWE < 0.05, using a cluster-forming threshold of p < 0.001, uncorrected.
Results
Four patients had no post-assessment PET scans, and one of them also lacked post-assessment TMS measurements. The patients and the healthy controls did not differ significantly in age or gender distribution (Table 1). Binding potentials of [11C]flumazenil, rMT, and ppTMS outcomes for the total sample and separated by group are displayed in Table 2. There were no differences in [11C]flumazenil binding in the M1 sphere or left paracentral lobule between healthy controls and patients at baseline. Neither were there any differences in SICI, LICI, ICF, or hand rMT between healthy controls and patients. The median SICI differed between assessments; however, for the remaining outcomes, there were no differences in median values between pre- and post-assessments.
Comparisons of demographical and clinical variables for healthy controls (HC) and patients with a major depressive episode (MDE)*
| HC (n = 15) | MDE* (n = 28) | p value | ||
|---|---|---|---|---|
| Median age, years (q1, q3) | 26 (23, 41.5) | 26.5 (22, 34) | U = 240 | 0.44 |
| Age range, years | 21–57 | 18–54 | ||
| Female gender, n (%) | 9 (60.0) | 13 (46.4) | χ2 = 0.72 | 0.40 |
| Right handed, n (%) | - | 25 (89.3) | ||
| Ongoing medication, n (%) | ||||
| Antidepressants | 24 (85.7) | |||
| Antipsychotics | 5 (17.8) | |||
| Lithium | 5 (17.8) | |||
| Antiepileptics | 2 (7.1) | |||
| No medication | 3 (10.7) | |||
| MADRS-S, median (q1, q3) | 2 (1.5, 4) | 31.5 (24, 35) | ||
| MSM, total score, median (q1, q3) | 10.5 (9, 12) | |||
| Duration, n (%) | ||||
| ≤12 months | 2 (7.1) | |||
| 13–24 months | 1 (3.6) | |||
| >24 months | 25 (89.3) | |||
| Symptom severity, n (%) | ||||
| Moderate | 15 (53.6) | |||
| Severe without psychosis | 12 (42.8) | |||
| Severe with psychosis | 1 (3.6) | |||
| Treatment failures | ||||
| Antidepressants, n (%) | ||||
| 1–2 medications | 1 (3.6) | |||
| 3–4 medications | 10 (35.7) | |||
| 5–6 medications | 5 (17.8) | |||
| 7–10 medications | 10 (35.7) | |||
| >10 medications | 2 (7.1) | |||
| Augmentation, n (%) | 20 (71.4) | |||
| ECT, n (%) | 12 (42.8) | |||
HC, healthy controls; MDE, major depressive episode; n, number of subjects; q, quartile; MADRS-S, self-rating version of Montgomery-Åsberg Depression Rating Scale; MSM, Maudsley Staging Method for treatment resistance; ECT, electroconvulsive therapy; U, Mann-Whitney U test; χ2, Chi-square test.
*Ongoing depressive episode in major depressive disorder or bipolar disorder (n = 2).
Comparisons of non-displaceable binding potentials (BPND) and transcranial magnetic stimulation measures for healthy controls (HC) and patients with a major depressive episode (MDE)
| Whole sample (n = 43) | HC (n = 15) | MDE | Mann-Whitney U test for HC versus MDD pre | Wilcoxon signed-rank test for pre- versus post-assessments | |||||
|---|---|---|---|---|---|---|---|---|---|
| pre (n = 28) | post (n = 27) | change | U | p value | W | p value | |||
| BPND M1 sphere, median (q1, q3) | 5.24 (4.88, 5.68) | 5.18 (4.90, 5.58) | 5.32 (4.86, 5.71) | 5.45 (4.99, 5.66)a | −0.07 (−0.26, 0.22) | 187 | 0.57 | 167 | 0.64 |
| BPND left PcL, median (q1, q3) | 4.58 (4.28, 4.97) | 4.47 (4.38, 4.71) | 4.58 (4.26, 4.99) | 194 | 0.70 | ||||
| SICI, median (q1, q3) | 0.28 (0.16, 0.54) | 0.26 (0.10, 0.48) | 0.31 (0.23, 0.56) | 0.54 (0.32, 0.70) | 0.10 (−0.04, 0.22) | 156 | 0.18 | 97 | 0.03 |
| LICI, median (q1, q3) | 0.30 (0.09, 0.49)* | 0.22 (0.04, 0.46) | 0.30 (0.20, 0.51) | 0.41 (0.15, 0.64) | −0.01 (−0.06, 0.03) | 169 | 0.39 | 168 | 0.62 |
| ICF, median (q1, q3) | 1.29 (1.03, 1.96) | 1.28 (0.94, 1.90) | 1.30 (1.06, 2.00) | 1.28 (0.98, 1.64) | −0.06 (−0.39, 0.27) | 186 | 0.55 | 219 | 0.48 |
| Hand rMT, % MSO (q1, q3) | 35 (30, 40) | 35 (32, 39) | 34 (29, 41) | 36 (31, 42) | 1 (−1, 4) | 223 | 0.76 | 81 | 0.08 |
| Foot rMT, % MSO (q1, q3) | 48 (46, 58) | ||||||||
HC, healthy controls; MDE, major depressive episode; n, number of subjects; BPND, non-displaceable binding potential; q, quartile; M1 sphere, volume including hand motor cortex; PcL, paracentral lobule; SICI, short-interval intracortical inhibition; LICI, long-interval intracortical inhibition; ICF, intracortical facilitation; rMT, resting motor threshold; MSO, maximum stimulator output.
*n = 42.
an = 24.
BPND in the M1 sphere was not correlated to rMT or the ppTMS measurements at baseline in either the whole sample or the groups separately (Table 3). Foot rMT, available only in the patient group, did not correlate to BPND in the left paracentral lobule (rs = −0.090, p = 0.65).
Correlations between baseline transcranial magnetic stimulation measures and non-displaceable binding potentials (BPND) in healthy controls (HC) and patients with a major depressive episode (MDE)
| BPND | ||||||||
|---|---|---|---|---|---|---|---|---|
| M1 sphere | left PcL | |||||||
| whole sample | HC | MDE | MDE | |||||
| rs | p value | rs | p value | rs | p value | rs | p value | |
| SICI | −0.07 | 0.65 | −0.325 | 0.24 | 0.122 | 0.54 | ||
| LICI | −0.16 | 0.32 | −0.345 | 0.21 | −0.078 | 0.70 | ||
| ICF | −0.15 | 0.35 | −0.443 | 0.10 | −0.060 | 0.76 | ||
| rMT | −0.19 | 0.22 | −0.408 | 0.13 | −0.156 | 0.43 | −0.09 | 0.65 |
| rMT adjusted for distance scalp-cortex | −0.23 | 0.14 | −0.416 | 0.14 | −0.204 | 0.31 | ||
BPND, non-displaceable binding potential; M1 sphere, volume including hand motor cortex; PcL, paracentral lobule; HC, healthy controls; MDE, major depressive episode; SICI, short-interval intracortical inhibition; LICI, long-interval intracortical inhibition; ICF, intracortical facilitation; rMT, resting motor threshold; rs, Spearman’s rho.
The results from the pre-post change analyses are shown in Table 4. Changes in M1 sphere BPND, between pre- and post-assessments, were inversely correlated to pre-post changes in hand rMT (Fig. 2). This result remained significant after adjusting for multiple comparisons. The correlation between changes in BPND and hand rMT did not differ between those receiving active or sham treatment (z = 0.38, p = 0.7). No correlations were detected between pre-post change in M1 sphere BPND and pre-post changes in SICI, LICI, or ICF.
Correlations between pre- and post-assessment changes in transcranial magnetic stimulation measures and pre-post changes in non-displaceable binding potentials (BPND) in the hand motor cortex in patients with a major depressive episode (MDE)
| BPND change (MDE) | |||
|---|---|---|---|
| M1 sphere | |||
| rs | p value | α Holm-Bonferroni | |
| SICI change | −0.01 | 0.95 | 0.050 |
| LICI change | −0.18 | 0.42 | 0.017 |
| ICF change | −0.13 | 0.53 | 0.025 |
| rMT change | −0.52 | 0.01 | 0.012 |
| rMT change adjusted for distance scalp-cortex | −0.56 | 0.006 | 0.010 |
BPND, non-displaceable binding potential; MDE, major depressive episode; M1 sphere, volume including hand motor cortex; SICI, short-interval intracortical inhibition; LICI, long-interval intracortical inhibition; ICF, intracortical facilitation; rMT, resting motor threshold; rs, Spearman’s rho.
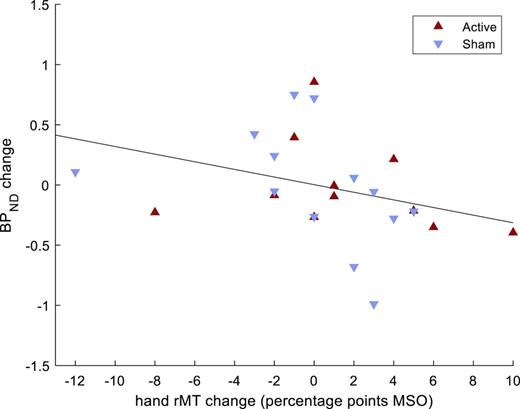
Correlation between pre- and post-assessment changes in non-displaceable binding potentials (BPND) in hand motor cortex and pre-post changes in hand resting motor threshold (rMT), in patients with a major depressive episode. N = 24 (4 patients lacked post-assessments). MSO, maximum stimulator output.
Correlation between pre- and post-assessment changes in non-displaceable binding potentials (BPND) in hand motor cortex and pre-post changes in hand resting motor threshold (rMT), in patients with a major depressive episode. N = 24 (4 patients lacked post-assessments). MSO, maximum stimulator output.
Voxel-wise regression analyses between BPND and SICI, LICI, ICF, hand rMT, and foot rMT did not yield any significant clusters in the brain. Similarly, voxel-wise regression analyses between pre-post change in BPND and pre-post changes in SICI, LICI, ICF, and hand rMT did not result in any significant findings (data not shown).
Discussion
This is the first study assessing the relationship between GABAA receptor availability, measured with [11C]flumazenil PET, and TMS measures of both inhibition and excitation in the primary motor cortex. We found no correlations between baseline BPND and SICI, LICI, ICF, hand rMT, or foot rMT. However, we did find an inverse correlation between pre- and post-assessment GABAA receptor availability changes in the left hand motor region and pre-post changes in hand rMT.
The motor threshold is considered a global measure of corticospinal excitability, primarily reflecting the membrane excitability of the corticospinal neurons and interneurons projecting onto them [20, 43]. Acute pharmacologic modulation with GABAA receptor agonists does not impact the motor threshold, implying that synaptic phasic inhibition mediated by GABAA receptors does not significantly contribute to the net motor threshold [43]. Instead, the motor threshold is thought to be influenced by tonic inhibition onto the cortical output neurons [20]. Based on these previous findings, the inverse correlation we observed between changes in GABAA receptor availability and changes in rMT is unlikely to reflect a change in [11C]flumazenil binding to synaptic GABAA receptors, but perhaps rather an alteration in extrasynaptic GABAA receptor binding, which could affect tonic inhibition [2].
The complex neural connections of excitatory and inhibitory neurons, as well as inhibitory interneurons projecting to one another, combined with a large population of neurons being targeted with TMS, make it difficult to predict the net result of a change in inhibitory signalling. Given this, a decrease in GABAA receptor availability could be associated with an increase of hand rMT, as in our findings. Our observation may support the hypothesis of GABA system deficiency in depression together with TMS studies that show increased motor thresholds in depressed patients [3, 21‒23].
We found no correlation between baseline [11C]flumazenil BPND and TMS measures, neither in the volumes of interest nor in whole-brain voxel-wise regression analyses. This is in agreement with the only previous study examining the relationship between GABAA receptor availability and ppTMS GABAA measures [26]. Our study extends these findings to include patients with depression, additional TMS measures, and correlation analyses of change between pre- and post-assessments to address inter-individual variation.
Healthy controls and patients did not differ in GABAA receptor availability in the left hand motor region or left paracentral lobule. The same data have also been analysed previously in whole-brain voxel-wise analyses without revealing any significant differences between patients and controls [18]. This is similar to a SPECT study that could not find any difference in benzodiazepine-binding in depressed and healthy controls, but opposed to a PET study that found reduced temporal GABAA receptor binding in depressed patients [15, 16]. The PET study did use a more liberal statistical threshold (p < 0.001, uncorrected) which may explain the dissimilarities in results.
Likewise, we could not find any differences in ppTMS cortical excitability measures reflecting GABAA, GABAB, or glutamate NMDA receptor-mediated activity between patients and controls. Earlier ppTMS findings are heterogeneous, with only a few studies being able to demonstrate differences between healthy and depressed individuals [24]. A meta-analysis reported lower GABAA and GABAB receptor-mediated activity, and probably higher glutamate NMDA receptor-mediated activity among depressed patients [24]. However, reported effect sizes were small, and SICI was not significantly lower when studies with vascular depression were included. One study that compared different types of depression, found decreased GABAA receptor-mediated activity and increased glutamatergic NMDA receptor-mediated activity in atypical depression compared with melancholic or undifferentiated depression [23]. Furthermore, there have been findings of lower SICI in treatment-resistant depression compared with healthy subjects, unmedicated patients with depression, and medicated euthymic patients [22]. This could indicate to variance in cortical excitability due to depression subtype. Median treatment resistance score was high in our sample, but lack of further differentiation of depression subtype may be a contributing reason to the lack of altered cortical excitability in the patient group.
Limitations
Ideally, we would have recorded the anatomical coordinates for coil placement during TMS to define individual volumes of interest. However, since scanning was performed after TMS, we opted to define a group-level volume of interest in the motor cortex that corresponded to the area most likely targeted by TMS on average. The method using coordinates from an activation likelihood estimation analysis adjusted to subject space does not account for individual variability and may be too imprecise to detect more regionally specific and subtler relationships.
Regrettably, we only had information of handedness for the patients and not for the controls. Additionally, although we assumed a 4-week mean menstrual cycle, we did not account for the individual menstrual cycles and the potential impact of neurosteroids on the outcome. Despite our relatively large sample size for a PET study, it may still be insufficient to detect alterations in depression with TMS when compared with healthy controls. In a recent meta-analysis, a majority of the included studies did not find a difference for SICI and ICF between patients and controls, although significant differences emerged from the meta-analysis [24]. The TMS outcome can be influenced by ongoing medication, resulting in different findings compared with unmedicated subjects [43]. However, this factor does not account for the lack of a relationship observed in healthy participants, reported here and in an earlier study [26].
Methodological Limitations regarding GABAA Receptor Subtypes
The current understanding of ppTMS-derived measures of cortical excitability is based on pharmacological ppTMS experiments [43]. SICI is suggested to be mediated by GABAA receptors containing subunits α2 and α3, as benzodiazepines enhance SICI, while zolpidem, with main affinity to the α1-subunit, has no effect on SICI [44]. Conversely, the benzodiazepine antagonist flumazenil, used as a proxy for GABA receptor availability in PET, has affinity to all six α-subunits [45]. Further, GABA subunit composition varies between brain regions. Regarding α-subunits, α1 is widespread throughout the brain, while other α-subunits display more localised distribution [14]. The motor cortex has a high abundance of α1 and less of α2–5 [46].
Considering the above, SICI appears to capture only a portion of the GABAergic activity through available GABAA receptors in the motor cortex and excludes activity through the most prominent isoform, α1β2γ2 [46]. In contrast, GABAA availability through [11C]flumazenil binding seems to provide an estimate for all α-subunits. In order for these two measures to correlate, a change in availability of GABAA receptors in the motor cortex will need to affect either subunits α2 and α3 predominately or all α-subunit containing subtypes to a similar degree.
The distribution of GABAA receptor subtypes may vary due to age and in neurodegenerative disorders [47]. It is possible that such changes also occur in depressive disorders. Since flumazenil binds to all α-subunits, [11C]flumazenil PET cannot detect such changes in subtype distribution. Moreover, the homomeric rho-containing GABAA receptor subtype cannot be detected by either ppTMS or [11C]flumazenil PET. These GABAA receptors, previously classified as receptor-type GABAC, were initially found only in the retina. Subsequently, heteromeric rho-containing GABAA receptors have been discovered in other parts of the mammalian brain, including the cortex; however, the abundance of these receptors remains unknown [2, 48].
Conclusion
We found that a change in GABAA receptor availability was inversely associated with a change in rMT, implying a link between GABA deficiency and the increased rMT observed in depressive disorders. Our findings highlight the complex mechanisms governing cortical excitability measures and offer new insights into the properties of these measures during the depressive state.
However, we were unable to find any additional correlations between GABAA receptor availability and cortical excitability measured by TMS. Given the significant inter-individual variability in cortical excitability measures, it is possible that correlating delta values may yield greater sensitivity than cross-sectional measurements. Moreover, as [11C]flumazenil PET and ppTMS seem to reflect different GABAA receptor isoforms, a relationship between GABAA receptor availability and cortical excitability may still exist that cannot be detected using the current method.
Statement of Ethics
The study protocol was reviewed and approved by the Research Ethical Review Board in Uppsala, reference number 2017/073, and conducted in accordance with the Helsinki Declaration. All participants gave a written informed consent to their participation.
Conflict of Interest Statement
The authors have no conflicts of interest to declare.
Funding Sources
This research was supported by unrestricted grants from the Swedish Research Council (Grant No. 2016–02,362), the Swedish Society of Medicine, and Märta and Nicke Nasvell Foundation. R.B. was supported by a Gullstrand Research Fellow grant from Uppsala University Hospital. J.P. was supported by a postdoctoral grant from the Swedish Brain Foundation, and D.F. by the Swedish Brain Foundation (Grant No. PS2021-0026) and the Swedish Society for Medical Research (SSMF, Grant No. PD21-0136). The study was also supported by grants from Stiftelsen Professor Bror Gadelius Minnesfond (L.S., E.T.) and Fredrik och Ingrid Thurings Stiftelse (E.T.). Funding sources did not have any role in study design, analyses, interpretation of the data, writing of the report, or decision to submit the results.
Author Contributions
L.S.: methodology, data curation, formal analysis, software, writing – original draft preparation, and writing – review and editing; E.T.: methodology, data curation, formal analysis, writing – original draft preparation, and writing – review and editing; R.B.: conceptualization, methodology, funding acquisition, investigation, project administration, resources, supervision, and writing – review and editing; A.W.: methodology, software, data curation, formal analysis, and writing – review and editing; H.A.: methodology and writing – review and editing; M.L.: methodology, software, data curation, and writing – review and editing; D.F.: investigation and writing – review and editing; and J.P.: conceptualization, methodology, software, data curation, funding acquisition, investigation, project administration, resources, supervision, and writing – review and editing.
Data Availability Statement
Data are not available due to ethical and legal constraints. Further enquiries can be directed to the corresponding author.
References

