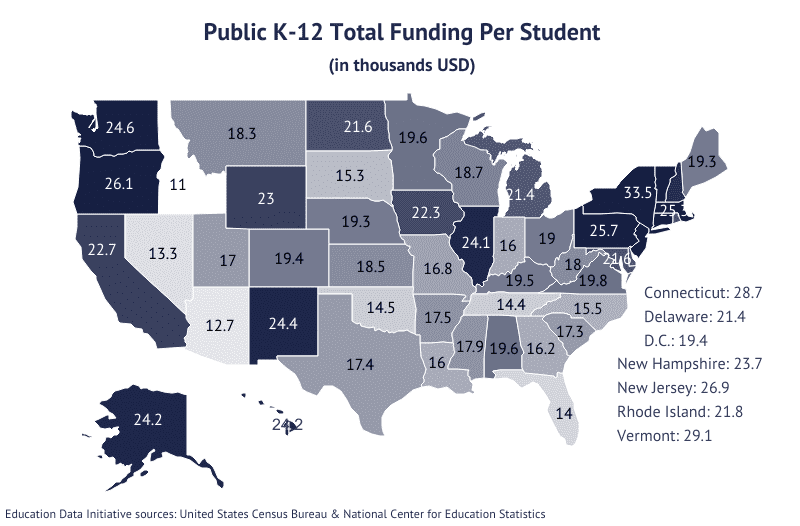
Report Highlights. Public education spending in the United States falls short of global benchmarks and lags behind economic growth; K-12 schools spend $857.2 billion or $17,280 per pupil annually.
- Federal, state, and local governments provide $878.2 billion or $17,700 per pupil to fund K-12 public education.
- The difference between spending and funding is $21.0 billion or $420 per pupil.
- The federal government provides 13.6% of funding for public K-12 education.
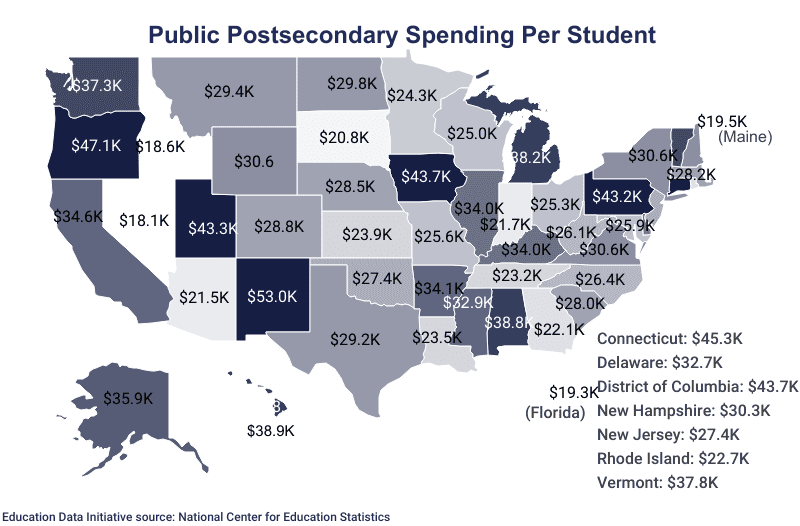
- Public postsecondary schools spend an average of $30,230 per pupil.
*Percentage totals do not always equal 100 due to rounding.
Jump to a State: AL | AK | AZ | CA | CO | CT | DE | FL | GA | HI | ID | IL | IN | IA | KS | KY | LA | ME | MD | MA | MI | MN | MS | MO | MT | NE | NV | NH | NJ | NM | NY | NC | ND | OH | OK | OR | PA | RI | SC | SD | TN | TX | UT | VT | VA | WA | WV | WI | WY
Related research includes Number of Public Schools in the US | K-12 Enrollment and Student Population | Average Cost of Private School | Average Cost of College | Average Cost of Community College
Public Education Spending Statistics
Public education spending at the national level services 49.6 million K-12 students and 13.9 million postsecondary students. It is normal for spending totals to undercut public funding totals to a degree.
- K-12 public schools spend $17,280 per pupil.
- Public K-12 expenditures total $857.2 billion.
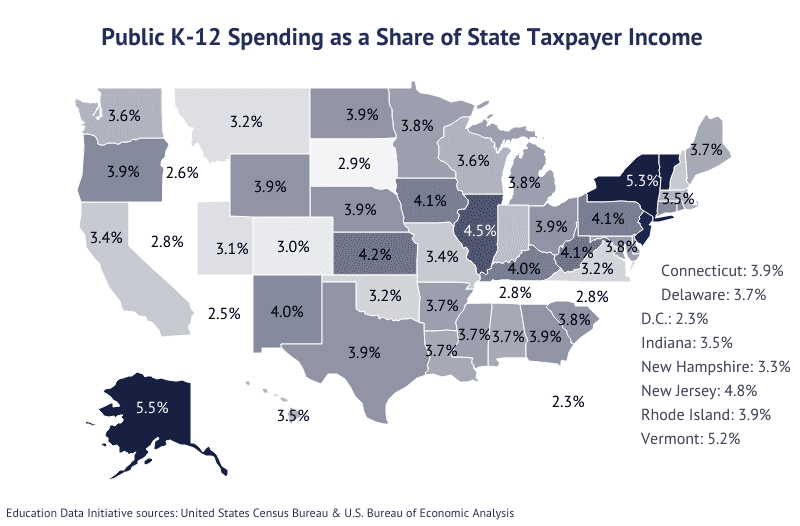
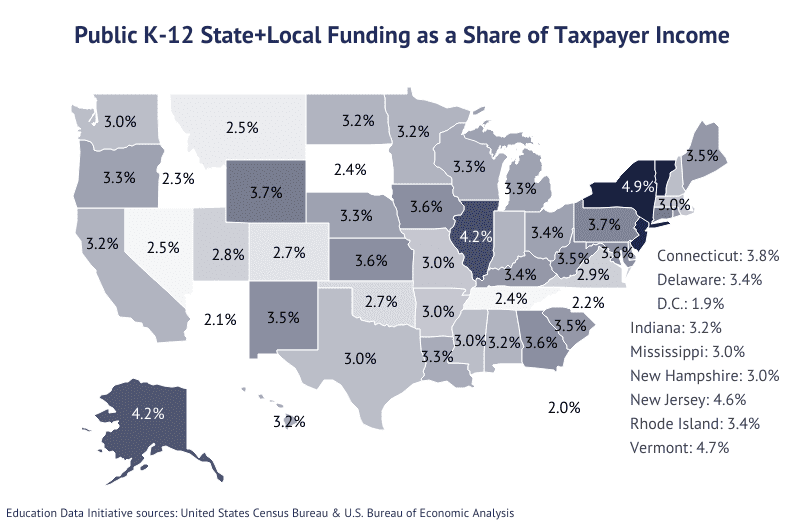
- Expenditures are equivalent to 3.68% of taxpayer income.
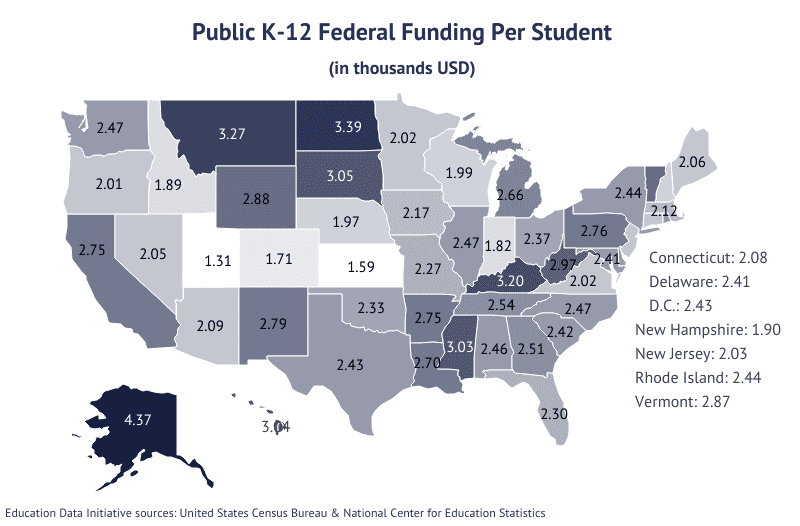
- K-12 schools nationwide receive $119.1 billion total or $2,400 per pupil from the federal government.
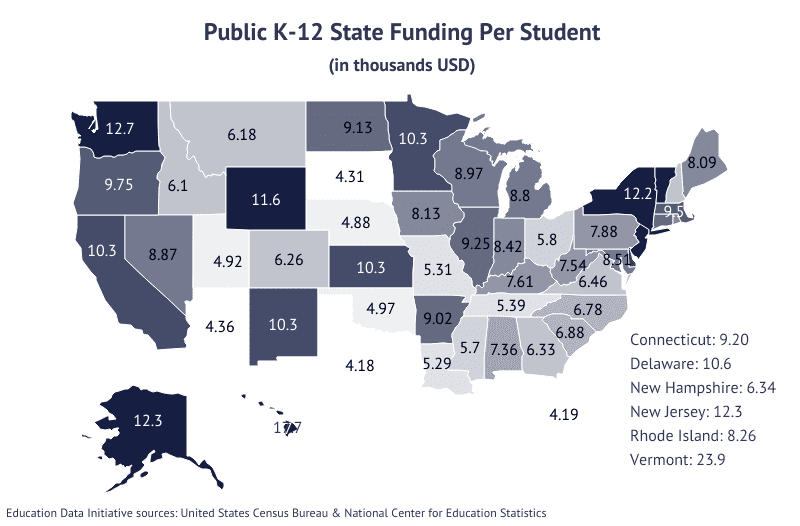
- States contribute a total of $383.9 billion to K-12 public education or $7,740 per student.
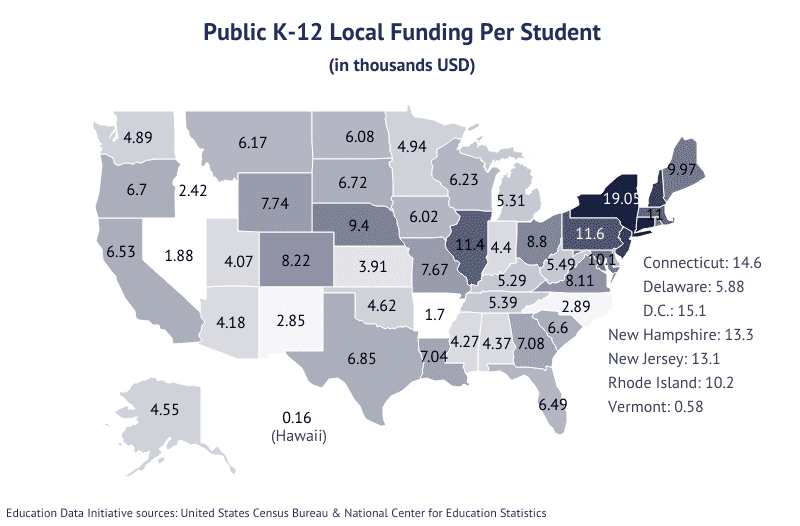
- Local governments contribute $375.2 billion total or $7,560 per student.
- Federal public education funding is equivalent to 0.51% of total taxpayer income.
- State and local funding is equivalent to 3.26%.
- Funding for K-12 education totals $878.2 billion or $17,700 per pupil.
- The difference between spending and funding is $21.0 billion, or $420 per pupil.
- At the postsecondary level, public colleges and universities spend $30,230 per pupil, 27.1% of which goes toward instruction.
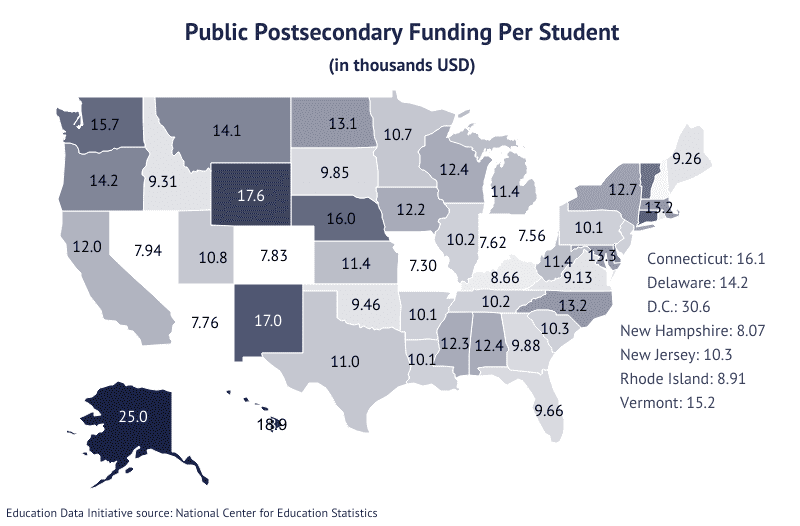
- Federal funding for public postsecondary institutions averages $2,650 per pupil, up 15.5% year-over-year (YoY).
- States and local governments contribute a combined $7,870.
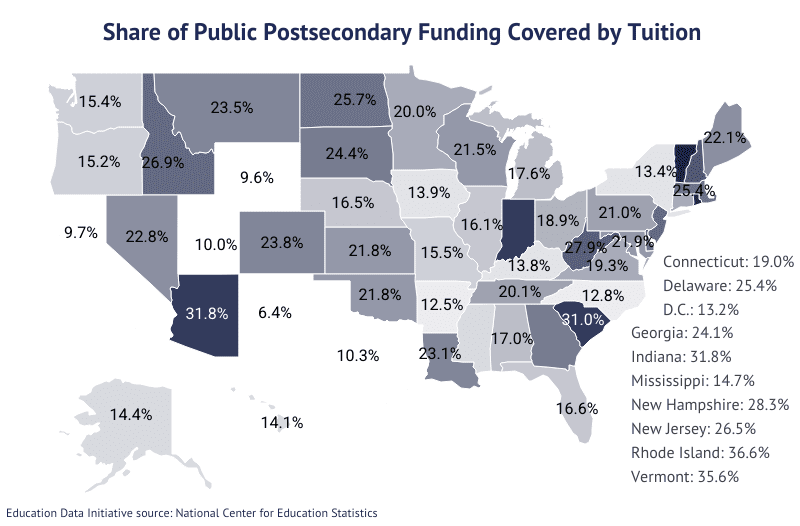
- Tuition accounts for 16.3% of all funding.
- 3.92% of all postsecondary funding comes from sales and services of auxiliary enterprises.
- 2-year public institutions spend 14.7% of what 4-year public colleges spend annually.
U.S. and World Education Spending
In the United States, education spending falls short of benchmarks set by international organizations such as UNESCO, of which the U.S. is a member. The nation puts 12.7% of public funding toward education, well below the international standard 15.00%.
- Schools in the United States spend an average of $19,973 per pupil, which is the 2nd-highest amount per pupil (after adjusting to local currency values) among the 40 other developed nations in the Organisation for Economic Co-operation and Development (OECD).
- In terms of a percentage of its gross domestic product (GDP), the United States ranks 4th among OECD members in spending on elementary education.
- The United States does not meet UNESCO’s benchmark of a 15.00% share of total public expenditure on education.
- In terms of early childhood education, the United States is one of nine (8) countries that do not report any educational spending.
- Luxembourg spends US $26,833 per pupil, which is more than any of the other OECD nations spend on education.
- Oceania nations, such as Australia and Marshall Islands, spend the highest amount on education in terms of a percentage of GDP.
- At 5.44%, the United States spends a larger percentage of its GDP on education than several other North American and European nations, which average 4.24% of GDP in educational spending.
| Country | Elementary Schools | Secondary Schools |
|---|---|---|
| Luxembourg | $22,990 | $27,112 |
| Korea | $13,278 | $14,805 |
| Slovenia | $10,714 | $11,398 |
| France | $9,673 | $12,139 |
| Spain | $9,077 | $10,658 |
| New Zealand | $8,438 | $9,286 |
| Colombia | $4,364 | $4,335 |
| Mexico | $2,750 | $2,411 |
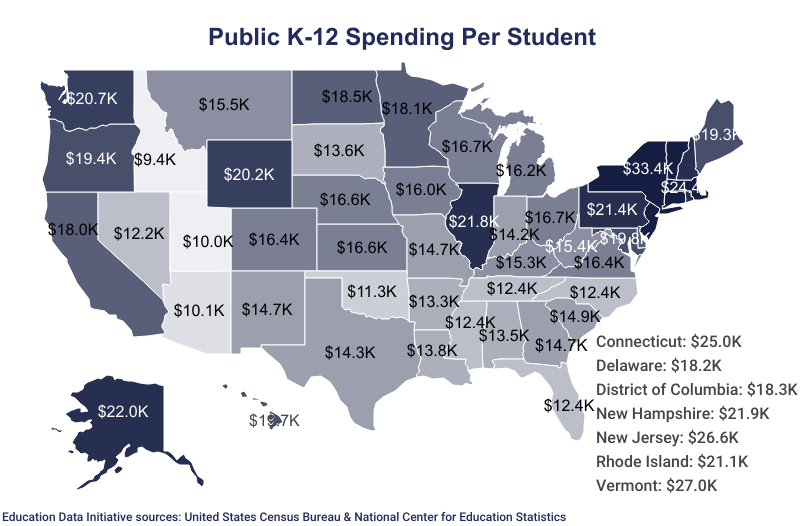
Public Education Spending by State
Education spending refers to the money spent by public schools. This may include teacher and administrator salaries, supplies, building maintenance, field trips, etc. These numbers refer to how much money has a direct impact on public school students.
- New York schools spend the most on K-12 education per pupil.
- California spends the most on postsecondary education.
- New York also spends the second most on K-12 education in terms of a percentage of local taxpayer income.
- Alaska K-12 schools spend the most in terms of a percentage of taxpayer income.
- Vermont K-12 public school students receive the second-most expensive education.
- Florida K-12 schools spend the least in terms of a percentage of local taxpayer income.
- North Dakota makes the most of its funding for K-12 education, having the least funds per pupil leftover after spending on students.
| State | K-12 Spending | Postsecondary Spending |
|---|---|---|
| New York | $33,440 | $34,030 |
| Vermont | $26,970 | $36,150 |
| New Jersey | $26,560 | $28,640 |
| Connecticut | $25,020 | $48,390 |
| Massachusetts | $24,360 | $30,040 |
| Alaska | $22,000 | $39,440 |
| New Hampshire | $21,900 | $32,990 |
| Illinois | $21,830 | $33,900 |
| Pennsylvania | $21,440 | $46,670 |
| Rhode Island | $21,050 | $24,520 |
| Washington | $20,750 | $40,180 |
| Wyoming | $20,160 | $32,040 |
| Maryland | $19,820 | $27,680 |
| Hawaii | $19,720 | $39,870 |
| Oregon | $19,380 | $49,320 |
| Maine | $19,310 | $19,380 |
| North Dakota | $18,490 | $30,030 |
| District of Columbia | $18,270 | $48,220 |
| Delaware | $18,200 | $32,440 |
| Minnesota | $18,060 | $25,460 |
| California | $18,020 | $36,190 |
| Wisconsin | $16,740 | $25,040 |
| Ohio | $16,690 | $27,340 |
| Nebraska | $16,640 | $28,280 |
| Kansas | $16,590 | $24,050 |
| Virginia | $16,440 | $31,110 |
| Colorado | $16,410 | $28,930 |
| Michigan | $16,210 | $39,830 |
| Iowa | $16,020 | $43,610 |
| Montana | $15,500 | $28,190 |
| West Virginia | $15,360 | $27,380 |
| Kentucky | $15,340 | $33,540 |
| South Carolina | $14,880 | $26,860 |
| Missouri | $14,700 | $25,840 |
| New Mexico | $14,690 | $53,120 |
| Georgia | $14,660 | $22,470 |
| Texas | $14,260 | $29,900 |
| Indiana | $14,160 | $21,580 |
| Louisiana | $13,760 | $23,910 |
| South Dakota | $13,640 | $20,640 |
| Alabama | $13,460 | $37,830 |
| Arkansas | $13,260 | $32,720 |
| Tennessee | $12,430 | $24,030 |
| Florida | $12,420 | $20,030 |
| Mississippi | $12,390 | $35,460 |
| North Carolina | $12,350 | $26,320 |
| Nevada | $12,230 | $18,520 |
| Oklahoma | $11,350 | $28,280 |
| Arizona | $10,090 | $20,520 |
| Utah | $9,980 | $41,980 |
| Idaho | $9,390 | $17,740 |
Public Education Funding by State
Educational funding or financing refers to how much money goes into schools, also sometimes referred to as revenue or income. Financing influences spending, but states rarely spend 100% of their public school funding.
- K-12 schools in Alaska receive the most funding per pupil from the federal government.
- North Dakota receives the second-most federal funding for K-12 schools.
- Utah receives the lowest amount per pupil from the federal government.
- Kansas receives the second-lowest amount per pupil in federal funding.
- Vermont’s state government spends the most per pupil of any state government to finance education.
- Hawaii supplies the second-most state funding.
- Texas’ state government supplies the lowest amount of educational financing per pupil.
| State | Federal Funding | State & Local Funding |
|---|---|---|
| Alaska | $4,370 | $16,810 |
| North Dakota | $3,390 | $15,210 |
| Montana | $3,270 | $12,350 |
| Kentucky | $3,200 | $12,900 |
| South Dakota | $3,050 | $11,030 |
| Hawaii | $3,040 | $17,900 |
| Mississippi | $3,030 | $9,970 |
| West Virginia | $2,970 | $13,040 |
| Wyoming | $2,880 | $19,300 |
| Vermont | $2,870 | $24,470 |
| New Mexico | $2,790 | $13,130 |
| Pennsylvania | $2,760 | $19,450 |
| Arkansas | $2,750 | $10,720 |
| California | $2,750 | $16,870 |
| Louisiana | $2,700 | $12,330 |
| Michigan | $2,660 | $14,110 |
| Tennessee | $2,540 | $10,790 |
| Georgia | $2,510 | $13,400 |
| Illinois | $2,470 | $20,690 |
| North Carolina | $2,470 | $9,670 |
| Washington | $2,470 | $17,570 |
| Alabama | $2,460 | $11,730 |
| New York | $2,440 | $31,200 |
| Rhode Island | $2,440 | $18,440 |
| District of Columbia | $2,430 | $15,120 |
| Texas | $2,430 | $11,030 |
| South Carolina | $2,420 | $13,480 |
| Delaware | $2,410 | $16,430 |
| Maryland | $2,410 | $18,600 |
| Ohio | $2,370 | $14,590 |
| Oklahoma | $2,330 | $9,590 |
| Florida | $2,300 | $10,680 |
| Missouri | $2,270 | $12,970 |
| Iowa | $2,170 | $14,140 |
| Massachusetts | $2,120 | $20,470 |
| Arizona | $2,090 | $8,530 |
| Connecticut | $2,080 | $23,820 |
| Maine | $2,060 | $18,060 |
| Nevada | $2,050 | $10,740 |
| New Jersey | $2,030 | $25,390 |
| Minnesota | $2,020 | $15,220 |
| Virginia | $2,020 | $14,570 |
| Oregon | $2,010 | $16,450 |
| Wisconsin | $1,990 | $15,210 |
| Nebraska | $1,970 | $14,270 |
| New Hampshire | $1,900 | $19,690 |
| Idaho | $1,890 | $8,520 |
| Indiana | $1,820 | $12,820 |
| Colorado | $1,710 | $14,490 |
| Kansas | $1,590 | $14,200 |
| Utah | $1,310 | $8,980 |
Public Education Spending in Alabama
Alabama spends less than the national average on K-12 education in terms of dollars-per-pupil but a similar amount in terms of percentage of taxpayers’ personal income. The state ranks 39th in funding and 41st in school spending.
- Alabama K-12 schools spend $13,460 per pupil for a total of $10.11 billion annually.
- That is equivalent to 3.67% of taxpayer income.
- Alabama K-12 schools receive $1.85 billion from the federal government, or $2,460 per student
- State funding totals $5.53 billion or $7,360 per student.
- Local funding totals $3.28 billion or $4,370 per pupil.
- State and local funding is equivalent to 3.20% of Alabama’s taxpayer income.
- Alabama’s federal education funding is equivalent to 0.67% of the state’s taxpayer income.
- Funding for K-12 education in Alabama totals $10.7 billion or $14,190 per pupil.
- The difference between spending and funding is $548.2 million or $730 per pupil.
- At the postsecondary level, public colleges and universities spend $38,850 per pupil, 18.4% of which goes toward instruction.
- Federal funding for public postsecondary institutions averages $4,550 per student.
- State funding and local funding to postsecondary institutions averages $7,870 per student.
- Tuition accounts for 17.0% of all funding; this is down 22.9% YoY.
- 4.92% of all postsecondary funding comes from sales and services of auxiliary enterprises.
- Alabama’s 2-year community colleges spend 10.3% of what 4-year public colleges spend annually.
Public Education Spending in Alaska
Alaska spends the most on K-12 education in terms of percentage of taxpayer income and ranks 6th overall in the most spending per pupil. Alaska’s schools rank 10th in funding and are the most dependent on federal funding.
- Alaskan K-12 public schools spend $22,000 per pupil for a total of $2.88 billion annually.
- Expenditures are equivalent to 5.35% of taxpayer income.
- Alaska K-12 schools receive $571.2 million or $4,370 per pupil, from the federal government.
- State funding totals $1.60 billion or $12,270per pupil.
- Local funding totals $594.5 million or $4,550 per pupil.
- State and local funding is equivalent to 4.09% of Alaska’s taxpayer income.
- Alaska’s federal education funding is equivalent to 1.06% of the state’s taxpayer income.
- Funding for K-12 education in Alaska totals $2.77 billion or $21,180 per pupil.
- Alaska school spending exceeds funding by $106.1 million or $810 per pupil.
- At the postsecondary level, public colleges and universities spend $35,890 per pupil, 27.9% of which goes toward instruction.
- Federal funding for public postsecondary institutions averages $7,580 per student.
- State and local funding averages a combined $17,370 per student.
- Tuition accounts for 14.4% of all funding, which is a 12.8% decrease YoY.
- 2.14% of all postsecondary funding in Alaska comes from sales and services of auxiliary enterprises.
Public Education Spending in Arizona
Arizona schools spend less on K-12 education than the national average. The state’s government also spends less on education per capita. Arizona ranks 49th in spending and 49th in funding.
- Arizona K-12 schools spend $10,090 per pupil for a total of $11.4 billion annually.
- Expenditures are equivalent to 2.46% of taxpayer income.
- Arizona K-12 schools receive $2.36 billion, or $2,090 per pupil, from the federal government.
- State funding totals $4.93 billion or $4,360 per pupil.
- Local funding totals $4.73 billion or $4,180 per pupil.
- State and local funding is equivalent to 2.08% of Arizona’s taxpayer income.
- Federal education funding is equivalent to 0.51% of the state’s taxpayer income.
- Funding for K-12 education in Arizona totals $12.0 billion or $10,620 per pupil.
- The difference between spending and funding is $601.5 million or $530 per pupil.
- At the postsecondary level, public colleges and universities spend $21,500 per pupil, 31.6% of which goes toward instruction.
- Federal funding for public postsecondary institutions averages $1,880 per student.
- State and local funding averages a combined $5,890 per student.
- Tuition accounts for 31.8% of all funding, which is 7.20% decrease from the previous year.
- 3.58% of all postsecondary funding comes from sales and services of auxiliary enterprises.
- Arizona’s 2-year community colleges spend 24.7% of what its 4-year public colleges spend in a year.
Public Education Spending in Arkansas
Arkansas schools spend less per K-12 pupil than the national average. The state ranks 42nd in spending and 41st in funding.
- Arkansas K-12 schools spend $13,260 per pupil for a total of $6.54 billion annually.
- Expenditures are equivalent to 3.91% of taxpayer income.
- Arkansas K-12 schools receive $1.36 billion, or $2,750per pupil, from the federal government.
- State funding totals $4.45 billion or $9,020 per pupil.
- Local funding totals $838.8 million or $1,700 per pupil.
- State and local funding is equivalent to 3.16% of Arkansas’ taxpayer income.
- Arkansas’ federal education funding is equivalent to 0.81% of the state’s taxpayer income.
- Funding for K-12 education in Arkansas totals $6.64 billion or $13,470 per pupil.
- The difference between spending and funding is $102.6 million or $210 per pupil.
- At the postsecondary level, public colleges and universities spend $34,100 per pupil, 20.9% of which goes toward instruction.
- Federal funding for public postsecondary institutions averages $2,180 per student.
- State and local funding averages a combined $7,920 per student.
- Tuition accounts for 12.5% of all funding, which is a 9.7% decrease from the previous year.
- 5.80% of all postsecondary funding comes from sales and services of auxiliary enterprises.
- Arkansas’ 2-year community colleges spend 11.8% of what its 4-year public colleges spend in a year.
Public Education Spending in California
California receives 13.7% of all educational funding for U.S. public primary schools. With 5.93 million students enrolled statewide, California schools receive comparatively little federal funding per K-12 student. The state ranks 21st in spending and 16th in funding.
- California K-12 schools spend $18,020 per pupil for a total of $106.9 billion annually.
- Expenditures are equivalent to 3.37% of taxpayer income.
- California K-12 schools receive $16.30 billion, or $2,750 per pupil, from the federal government.
- State funding totals $61.3 billion or $10,340 per pupil.
- Local funding totals $38.7 billion or $6,530 per pupil.
- State and local funding is equivalent to 3.15% of California’s taxpayer income.
- California’s federal education funding is equivalent to 0.51% of the state’s taxpayer income.
- Funding for K-12 education in California totals $116.3 billion or $19,610 per pupil.
- The difference between spending and funding is $9.5 billion or $1,590 per pupil.
- At the postsecondary level, public colleges and universities spend $34,630 per pupil, 22.8% of which goes toward instruction.
- Federal funding for public postsecondary institutions averages $2,190 per student.
- State and local funding averages a combined $9,800 per student.
- Tuition accounts for 9.7% of all funding, which is a 18.1% decline from the previous year.
- 1.06% of all postsecondary funding comes from sales and services of auxiliary enterprises.
- California’s 2-year community colleges spend 22.1% of what its 4-year public colleges spend in a year.
Public Education Spending in Colorado
Colorado K-12 schools spend less per pupil than the national average. Colorado ranks 27th in spending and 28th in funding.
- K-12 schools spend $16,410 per pupil for a total of $14.3 billion annually.
- Expenditures are equivalent to 3.04% of taxpayer income.
- Colorado K-12 schools receive $1.49 billion, or $1,710 per pupil from the federal government.
- State funding totals $5.46 billion or $6,260 per pupil.
- Local funding totals $7.16 billion or $8,220 per pupil.
- State and local funding is equivalent to 2.68% of Colorado’s taxpayer income.
- Colorado’s federal education funding is equivalent to 0.32% of the state’s taxpayer income.
- Funding for K-12 education in Colorado totals $14.1 billion, or $16,200 per pupil.
- Colorado school spending exceeds funding by $185.6 million or $210 per pupil.
- At the postsecondary level, public colleges and universities spend $28,840 per pupil, 32.6% of which goes toward instruction.
- Federal funding for public postsecondary institutions averages $4,630 per student.
- State and local funding averages a combined $3,200 per student.
- Tuition accounts for 23.8% of all funding, which is a decline of 17.4% from the previous year.
- 4.71% of all postsecondary funding comes from sales and services of auxiliary enterprises.
- Colorado’s 2-year community colleges spend 2.73% of what its 4-year public colleges spend in a year.
Public Education Spending in Connecticut
Connecticut K-12 schools spend more per pupil than most other states. The state receives comparatively little in federal funding. Connecticut ranks 4th in spending and in funding.
- K-12 schools spend $25,020 per pupil for a total of $12.9 billion annually.
- Expenditures are equivalent to 4.01% of taxpayer income.
- Connecticut K-12 schools receive $1.1 billion, or $2,080 per pupil, from the federal government.
- State funding totals $4.72 billion or $9,200 per pupil.
- Local funding totals $7.51 billion or $14,630 per pupil.
- State and local funding is equivalent to 3.82% of Connecticut’s taxpayer income.
- Federal education funding is equivalent to 0.33% of the state’s taxpayer income.
- Funding for K-12 education in Connecticut totals $13.3 billion or $25,900 per pupil.
- The difference between spending and funding is $450.6 million or $880 per pupil.
- At the postsecondary level, public colleges and universities spend $45,280 per pupil, 26.2% of which goes toward instruction.
- Federal funding for public postsecondary institutions averages $2,350 per student.
- State and local funding averages a combined $13,780 per student.
- Tuition accounts for 19.0% of all funding, which is a decrease of 13.6% from the previous year.
- 3.37% of all postsecondary funding comes from sales and services of auxiliary enterprises.
- Connecticut’s 2-year community colleges spend 13.3% of what its 4-year public colleges spend in a year.
Public Education Spending in Delaware
Delaware spends more per K-12 pupil than the national average. The state ranks 19th in spending and 17th in funding.
- Delaware K-12 schools spend $18,200 per pupil for a total of $2.58 billion annually.
- Expenditures are equivalent to 3.76% of taxpayer income.
- Delaware K-12 schools receive $341.0 million , or $2,410 per pupil, from the federal government.
- State funding totals $1.49 billion or $10,550 per pupil.
- Local funding totals $831.7 million or $5,880 per pupil.
- State and local funding is equivalent to 3.40% of Delaware’s taxpayer income.
- Federal education funding is equivalent to 0.50% of the state’s taxpayer income.
- Funding for Delaware K-12 education totals $2.66 billion or $18,840 per pupil.
- The difference between spending and funding is $89.7 million, or $630 per pupil.
- At the postsecondary level, public colleges and universities spend $32,660 per pupil, 42.2% of which goes toward instruction.
- Federal funding for public postsecondary institutions averages $5,990 per student.
- State and local funding averages a combined $8,210 per student.
- Tuition accounts for 25.4% of all funding, which is a 34.3% decrease from the previous year.
- 3.24% of all postsecondary funding in Delaware comes from sales and services of auxiliary enterprises.
Public Education Spending in the District of Columbia
While District of Columbia K-12 schools spend more per pupil than most schools nationwide, these schools spend less in terms of a percentage of taxpayer income. D.C. ranks 20th in funding and 14th in spending.
- District of Columbia K-12 schools spend $18,270 per pupil for a total of $1.66 billion annually.
- Expenditures are equivalent to 2.39% of taxpayer income.
- District of Columbia K-12 schools receive $221.1 million, or $2,430 per pupil from the federal government.
- Local funding totals $1.38 billion, or $15,120per pupil.
- Local funding is equivalent to 1.98% of the District of Columbia’s taxpayer income.
- Federal education funding is equivalent to 0.32% of local taxpayer income.
- Funding for K-12 education in the District of Columbia totals $1.60 billion, or $17,550 per pupil.
- District of Columbia school spending exceeds funding by $65.3 million or $720 per pupil.
- At the postsecondary level, public colleges and universities spend $43,710 per pupil, 21.0% of which goes toward instruction.
- Federal funding for public postsecondary institutions averages $6,710 per student.
- Local funding averages $23,930 per student.
- Tuition accounts for 13.2% of all funding, which is a 1.21% smaller share than the previous year.
- 0.19% of all postsecondary funding in D.C. comes from sales and services of auxiliary enterprises.
Public Education Spending in Florida
Florida receives the third-largest amount of federal K-12 education funding. The state government funds education at a lower per-capita rate. Florida ranks 44th in spending and 45th in funding.
- Florida K-12 schools spend $12,420 per pupil for a total of $35.6 billion annually.
- Expenditures are equivalent to 2.27% of taxpayer income.
- Florida K-12 schools receive $6.60 billion or $2,300per pupil, from the federal government.
- State funding totals $12.0 billion or $4,190 per pupil.
- Local funding totals $18.6 billion or $6,490per pupil.
- State and local funding is equivalent to 1.95% of Florida’s taxpayer income.
- Federal education funding is equivalent to 0.42% of the state’s taxpayer income.
- Funding for K-12 education in Florida totals $37.2 billion or $12,970per pupil.
- The difference between spending and funding is $1.61 billion or $560 per pupil.
- At the postsecondary level, public colleges and universities spend $19,290 per pupil, 29.8% of which goes toward instruction.
- Among postsecondary schools, federal funding averages $1,790 per student.
- State and local funding averages a combined $7,860 per student.
- Tuition accounts for 16.6% of all funding, which is a 3.38% smaller share than the previous year.
- 5.10% of all postsecondary funding comes from sales and services of auxiliary enterprises.
- Florida’s 2-year community colleges spend 1.46% of what its 4-year public colleges spend in a year.
Public Education Spending in Georgia
Georgia K-12 schools spend less per pupil than the nationwide average. Georgia ranks 36th in spending and 32nd in funding.
- Georgia K-12 schools spend $14,660 per pupil for a total of $25.7 billion annually.
- Expenditures are equivalent to 3.91% of taxpayer income.
- Georgia K-12 schools receive $4.40 billion, or $2,510 per pupil, from the federal government.
- State funding totals $11.1 billion or $6,330 per pupil.
- Local funding totals $12.4 billion, or $7,080per pupil.
- State and local funding is equivalent to 3.57% of Georgia’s taxpayer income.
- Federal funding is equivalent to 0.67% of the state’s taxpayer income.
- Funding for K-12 education in Georgia totals $27.9 billion or $15,920 per pupil.
- The difference between spending and funding is $2.20 billion, or $1,260 per pupil.
- At the postsecondary level, public colleges and universities spend $22,110 per pupil, 24.0% of which goes toward instruction.
- Federal funding for public postsecondary institutions averages $2,870 per student.
- State local funding averages a combined $7,010 per student.
- Tuition accounts for 24.1% of all funding, which is a 0.48% smaller proportion than the previous year.
- 7.64% of all postsecondary funding comes from sales and services of auxiliary enterprises.
- Georgia’s 2-year community colleges spend 11.2% of what its 4-year public colleges spend in a year.
Public Education Spending in Hawaii
Hawaii spends more per K-12 pupil than most other states. The state ranks 14th in spending and 12th in funding.
- Hawaii K-12 schools spend $19,720 per pupil for a total of $3.36 billion annually.
- Expenditures are equivalent to 3.55% of taxpayer income.
- K-12 schools receive $517.3 million or $3,040 per pupil from the federal government.
- State funding totals $3.02 billion or $17,740 per pupil.
- Local funding totals $27.9 million or $160 per pupil.
- State and local funding is equivalent to 3.22% of Hawaii’s taxpayer income.
- Federal education funding is equivalent to 0.55% of the state’s taxpayer income.
- Funding for K-12 education in Hawaii totals $3.56 billion, or $20,940 per pupil.
- The difference between spending and funding is $208.3 million, or $1,220 per pupil.
- At the postsecondary level, public colleges and universities spend $38,890 per pupil, 30.9% of which goes toward instruction.
- Federal funding for public postsecondary institutions averages $6,300 per student.
- State and local funding averages a combined $12,580 per student.
- Tuition accounts for 14.1% of all funding, which is a 5.56% smaller proportion than the previous year.
- 2.07% of all postsecondary funding comes from sales and services of auxiliary enterprises.
- Hawaii’s 2-year community colleges spend 17.7% of what its 4-year public colleges spend in a year.
Public Education Spending in Idaho
Idaho schools spend the least of all states and ranks 50th in K-12 funding.
- Idaho K-12 schools spend $9,390 per pupil for a total of $2.98 billion annually.
- Expenditures are equivalent to 2.53% of taxpayer income.
- Idaho K-12 schools receive $600.6 million, or $1,890 per pupil, from the federal government.
- State funding totals $1.94 billion or $6,100 per pupil.
- Local funding totals $768.5 million or $2,420 per pupil.
- State and local funding is equivalent to 2.29% of Idaho’s taxpayer income.
- Idaho’s federal education funding is equivalent to 0.51% of the state’s taxpayer income.
- Funding for K-12 education in Idaho totals $3.31 billion or $10,410 per pupil.
- The difference between spending and funding is $325.7 million or $1,030 per pupil.
- At the postsecondary level, public colleges and universities spend $18,640 per pupil, 33.8% of which goes toward instruction.
- Federal funding for public postsecondary institutions averages $2,160 per student.
- State and local funding averages a combined $7,150 per student.
- Tuition accounts for 26.9% of all funding, which is a 0.37% smaller share than the previous year.
- 4.52% of all postsecondary funding comes from sales and services of auxiliary enterprises.
- Idaho’s 2-year community colleges spend 13.9% of what its 4-year public colleges spend in a year.
Public Education Spending in Illinois
Illinois ranks 8th in K-12 school spending and 5th in funding. Illinois schools receive more state and local funding in terms of a percentage of taxpayer income.
- Illinois K-12 schools spend $21,830 per pupil for a total of $40.4 billion annually.
- Expenditures are equivalent to 4.49% of taxpayer income.
- Illinois K-12 schools receive $4.57 billion, or $2,470 per pupil, from the federal government.
- State funding totals $17.1 billion or $9,250 per pupil.
- Local funding totals $21.2 billion or $11,440 per pupil.
- State and local funding is equivalent to 4.25% of Illinois’s taxpayer income.
- Federal education funding is equivalent to 0.51% of the state’s taxpayer income.
- Funding for K-12 education in Illinois totals $42.9 billion or $23,160 per pupil.
- The difference between spending and funding is $2.46 billion or $1,330 per pupil.
- At the postsecondary level, public colleges and universities spend $34,000 per pupil, 32.9% of which goes toward instruction.
- Federal funding for public postsecondary institutions averages $2,200 per student.
- State and local funding averages a combined $7,970 per student.
- Tuition accounts for 16.1% of all funding, which is a 13.7% smaller share than in the previous year.
- 3.95% of all postsecondary funding comes from sales and services of auxiliary enterprises.
- Illinois’ 2-year community colleges spend 33.9% of what its 4-year public colleges spend in a year.
Public Education Spending in Indiana
Indiana ranks 38th in K-12 school spending and in funding. The state receives relatively little from the federal government.
- Indiana K-12 schools spend $14,160 per pupil for a total of $14.7 billion annually.
- Expenditures are equivalent to 3.51% of taxpayer income.
- Indiana K-12 schools receive $1.88 billion, or $1,820 per pupil, from the federal government.
- State funding totals $8.73 billion or $8,420 per pupil.
- Local funding totals $4.56 billion or $4,400 per pupil.
- State and local funding is equivalent to 3.18% of Indiana’s taxpayer income.
- Federal education funding is equivalent to 0.45% of the state’s taxpayer income.
- Funding for K-12 education in Indiana totals $15.2 billion or $14,640 per pupil.
- The difference between spending and funding is $490.6 million or $470 per pupil.
- At the postsecondary level, public colleges and universities spend $21,660 per pupil, 37.9% of which goes toward instruction.
- Federal funding for public postsecondary institutions averages $2,030 per student.
- State and local funding averages a combined $5,590 per student.
- Tuition accounts for 31.8% of all funding, which is a 7.78% smaller share than in the previous year.
- 6.01% of all postsecondary funding comes from sales and services of auxiliary enterprises.
- Indiana’s 2-year community colleges spend 8.91% of what its 4-year public colleges spend in a year.
Public Education Spending in Iowa
Iowa ranks 29th in K-12 school spending and 26th in funding.
- Iowa K-12 schools spend $16,020 per pupil for a total of $8.19 billion annually.
- Expenditures are equivalent to 4.07% of taxpayer income.
- Iowa K-12 schools receive $1.11 billion, or $2,170 per pupil, from the federal government.
- State funding totals $4.16 billion or $8,130 per pupil.
- Local funding totals $3.08 billion or $6,020 per pupil.
- State and local funding is equivalent to 3.59% of Iowa’s taxpayer income.
- Federal education funding is equivalent to 0.55% of the state’s taxpayer income.
- Funding for K-12 education in Iowa totals $8.34 billion or $16,310 per pupil.
- The difference between spending and funding is $148.1 million or $290 per pupil.
- At the postsecondary level, public colleges and universities spend $43,720 per pupil, 17.8% of which goes toward instruction.
- Federal funding for public postsecondary institutions averages $4,360 per student.
- State and local funding averages a combined $7,810 per student.
- Tuition accounts for 13.9% of all funding, which is a 12.5% smaller share than in the previous year.
- 5.80% of all postsecondary funding comes from sales and services of auxiliary enterprises.
- Iowa’s 2-year community colleges spend 17.6% of what its 4-year public colleges spend in a year.
Public Education Spending in Kansas
Kansas ranks 25th in K-12 schools spending and 34th in funding. Kansas schools are more dependent on state funding than schools nationwide.
- K-12 schools spend $16,590 per pupil for a total of $8.10 billion annually.
- Expenditures are equivalent to 4.26% of taxpayer income.
- Kansas K-12 schools receive $777.8 million, or $1,590 per pupil, from the federal government.
- State funding totals $5.02 billion or $10,290 per pupil.
- Local funding totals $1.91 billion or $3,910 per pupil.
- State and local funding is equivalent to 3.65% of Kansas’ taxpayer income.
- Federal education funding is equivalent to 0.41% of the state’s taxpayer income.
- Funding for K-12 education in Kansas totals $7.71 billion or $15,800 per pupil.
- Kansas school spending exceeds funding by $388.4 million or $800 per pupil.
- At the postsecondary level, public colleges and universities spend $23,940 per pupil, 33.5% of which goes toward instruction.
- Federal funding for public postsecondary institutions averages $3,010 per student.
- State and local funding averages a combined $8,380 per student.
- Tuition accounts for 21.8% of all funding, which is a 9.25% smaller share than in the previous year.
- 8.45% of all postsecondary funding comes from sales and services of auxiliary enterprises.
- Kansas’ 2-year community colleges spend 26.9% of what its 4-year public colleges spend in a year.
Public Education Spending in Kentucky
Kentucky K-12 schools rank 32nd in spending but 29th in funding.
- K-12 schools spend $15,340 per pupil for a total of $10.1 billion annually.
- Expenditures are equivalent to 4.06% of taxpayer income.
- Kentucky K-12 schools receive $2.11 billion or $3,200 per pupil, from the federal government.
- State funding totals $5.02 billion or $7,160 per pupil.
- Local funding totals $3.49 billion or $5,290 per pupil.
- State and local funding is equivalent to 3.41% of Kentucky’s taxpayer income.
- Federal education funding is equivalent to 0.85% of the state’s taxpayer income.
- Funding for K-12 education in Kentucky totals $10.6 billion or $16,100 per pupil.
- The difference between spending and funding is $501.5 million or $760 per pupil.
- At the postsecondary level, public colleges and universities spend $33,970 per pupil, 19.4% of which goes toward instruction.
- Federal funding for public postsecondary institutions averages $2,770 per student.
- State and local funding averages a combined $5,900 per student.
- Tuition accounts for 13.8% of all funding, which is a 13.1% smaller share than in the previous year.
- 4.22% of all postsecondary funding comes from sales and services of auxiliary enterprises.
- Kentucky’s 2-year community colleges spend 9.29% of what its 4-year public colleges spend in a year.
Public Education Spending in Louisiana
Louisiana K-12 schools rank 39th in terms of spending and 37th in funding.
- K-12 schools spend $13,760 per pupil for a total of $9.88 billion annually.
- Expenditures are equivalent to 3.74% of taxpayer income.
- Louisiana K-12 schools receive $1.94 billion, or $2,700 per pupil, from the federal government.
- State funding totals $3.80 billion or $5,290 per pupil.
- Local funding totals $5.06 billion or $7,040 per pupil.
- State and local funding is equivalent to 3.35% of Louisiana’s taxpayer income.
- Federal funding for education is equivalent to 0.74% of the state’s taxpayer income.
- Funding for K-12 education in Louisiana totals $10.8 billion or $15,040 per pupil.
- The difference between spending and funding is $916.9 million or $1,280 per pupil.
- At the postsecondary level, public colleges and universities spend $23,470 per pupil, 28.1% of which goes toward instruction.
- Federal funding for public postsecondary institutions averages $1,500 per student.
- State and local funding averages a combined $8,620 per student.
- Tuition accounts for 23.1% of all funding, which is a 10.8% smaller share than in the previous year.
- 6.56% of all postsecondary funding comes from sales and services of auxiliary enterprises.
- Louisiana’s 2-year community colleges spend 12.0% of what its 4-year public colleges spend in a year.
Public Education Spending in Maine
Maine K-12 schools ranks 16th in spending and 14th in funding.
- K-12 schools spend $19,310 per pupil for a total of $3.36 billion annually.
- Expenditures are equivalent to 3.77% of taxpayer income.
- Maine K-12 schools receive $358.4 million, or $2,060 per pupil, from the federal government.
- State funding totals $1.41 billion or $8,090 per pupil.
- Local funding totals $1.73 billion or $9,970 per pupil.
- State and local funding is equivalent to 3.52% of Maine taxpayer income.
- Federal education funding is equivalent to 0.40% of the state’s taxpayer income.
- Funding for K-12 education in Maine totals $3.50 billion or $20,120 per pupil.
- The difference between spending and funding is $140.6 million or $810 per pupil.
- At the postsecondary level, public colleges and universities spend $19,500 per pupil, 32.9% of which goes toward instruction.
- Federal funding for public postsecondary institutions averages $1,600 per student.
- State and local funding averages a combined $7,660 per student.
- Tuition accounts for 22.1% of all funding, which is a 12.8% smaller share than in the previous year.
- 4.71% of all postsecondary funding comes from sales and services of auxiliary enterprises.
- Maine’s 2-year community colleges spend 16.8% of what its 4-year public colleges spend in a year.
Public Education Spending in Maryland
Maryland K-12 schools rank 13th in spending and 11th in funding. Maryland schools spend more per pupil than the nationwide average.
- K-12 schools spend $19,820 per pupil for a total of $17.6 billion annually.
- Expenditures are equivalent to 3.81% of taxpayer income.
- Maryland K-12 schools receive $2.14 billion, or $2,410 per pupil, from the federal government.
- State funding totals $7.57 billion or $8,510 per pupil among its public schools.
- Local funding totals $8.98 billion or $10,090 per pupil.
- State and local funding is equivalent to 3.57% of Maryland taxpayer income.
- Federal education funding is equivalent to 0.46% of the state’s taxpayer income.
- Funding for K-12 education in Maryland totals $18.7 billion or $21,000 per pupil.
- The difference between spending and funding is $1.06 billion or $1,190 per pupil.
- At the postsecondary level, Maryland public colleges and universities spend $25,870 per pupil, 28.3% of which goes toward instruction.
- Federal funding for public postsecondary institutions averages $2,990 per student.
- State and local funding averages a combined $10,280 per student.
- Tuition accounts for 21.9% of all funding, which is a 5.58% smaller share than in the previous year.
- 5.77% of all postsecondary funding comes from sales and services of auxiliary enterprises.
- Maryland’s 2-year community colleges spend 24.8% of what its 4-year public colleges spend in a year.
Public Education Spending in Massachusetts
Massachusetts ranks 5th in K-12 school spending and 6th in funding.
- Massachusetts K-12 schools spend $24,360 per pupil for a total of $22.5 billion annually.
- Expenditures are equivalent to 3.61% of taxpayer income.
- Massachusetts K-12 schools receive $1.96 billion, or $2,120 per pupil, from the federal government.
- State funding totals $8.77 billion or $9,500 per pupil.
- Local funding totals $10.1 billion or $10,970 per pupil.
- State and local funding is equivalent to 3.04% of Massachusetts taxpayer income.
- Federal education funding is equivalent to 0.31% of the state’s taxpayer income.
- Funding for K-12 education in Massachusetts totals $20.9 billion or $22,590 per pupil.
- Massachusetts school spending exceeds funding by $1.63 billion or $1,770 per pupil.
- At the postsecondary level, public colleges and universities spend $28,220 per pupil, 34.8% of which goes toward instruction.
- Federal funding for public postsecondary institutions averages $2,540 per student.
- State and local funding averages a combined $10,620 per student.
- Tuition accounts for 25.4% of all funding, which is a 5.96% smaller proportion than in the previous year.
- 4.20% of all postsecondary funding comes from sales and services of auxiliary enterprises.
- Massachusetts’ 2-year community colleges spend 20.3% of what its 4-year public colleges spend in a year.
Public Education Spending in Michigan
Michigan ranks 28th in K-12 school spending and 24th in funding.
- Michigan K-12 schools spend $16,210 per pupil for a total of $23.2 billion annually.
- Expenditures are equivalent to 3.83% of taxpayer income.
- Michigan K-12 schools receive $3.81 billion, or $2,660 per pupil, from the federal government.
- State funding totals $12.6 billion or $8,800 per pupil.
- Local funding totals $7.61 billion or $5,310 per pupil.
- State and local funding is equivalent to 3.33% of Michigan’s taxpayer income.
- Federal education funding is equivalent to 0.63% of the state’s taxpayer income.
- Funding for K-12 education in Michigan totals $24.0 billion or $16,770 per pupil.
- The difference between spending and funding is $800 million or $560 per pupil.
- At the postsecondary level, public colleges and universities spend $38,230 per pupil, 25.7% of which goes toward instruction.
- Federal funding for public postsecondary institutions averages $3,950 per student.
- State and local funding averages a combined $7,420 per student.
- Tuition accounts for 17.6% of all funding, which is a 30.5% smaller proportion than the previous academic year.
- 2.91% of all postsecondary funding comes from sales and services of auxiliary enterprises.
- Michigan’s 2-year community colleges spend 10.8% of what its 4-year public colleges spend in a year.
Public Education Spending in Minnesota
Minnesota ranks 20th in K-12 school spending and 21st in funding. Most educational funding comes from the state government.
- Minnesota K-12 schools spend $18,060 per pupil for a total of $15.7 billion annually.
- Expenditures are equivalent to 3.76% of taxpayer income.
- Minnesota K-12 schools receive $1.76 billion, or $2,020 per pupil, from the federal government.
- State funding totals $8.94 billion or $10,270 per pupil.
- Local funding totals $4.30 billion or $4,950 per pupil.
- State and local funding is equivalent to 3.17% of Minnesota’s taxpayer income.
- Federal education funding is equivalent to 0.42% of the state’s taxpayer income.
- Funding for K-12 education in Minnesota totals $15.0 billion or $17,240 per pupil.
- Minnesota school spending exceeds funding by $707.5 million or $810 per pupil.
- At the postsecondary level, public colleges and universities spend $24,310 per pupil, 30.5% of which goes toward instruction.
- Federal funding for public postsecondary institutions averages $2,140 per student.
- State and local funding averages a combined $8,550 per student.
- Tuition accounts for 20.0% of all funding, just 14.5% smaller proportionally compared to the previous academic year.
- 8.21% of all postsecondary funding comes from sales and services of auxiliary enterprises.
- Minnesota’s 2-year community colleges spend 24.6% of what its 4-year public colleges spend in a year.
Public Education Spending in Mississippi
Mississippi ranks 45th in K-12 school spending and 44th in funding. Public school spending is much lower than the nationwide average, but Mississippi taxpayers spend a larger proportion of their income on education.
- Mississippi K-12 schools spend $12,390 per pupil for a total of $5.46 billion annually.
- Expenditures are equivalent to 3.82% of taxpayer income.
- Mississippi K-12 schools receive $1.33 billion, or $3,030 per pupil, from the federal government.
- State funding totals $2.51 billion or $5,700 per pupil.
- Local funding totals $1.88 billion or $4,270 per pupil.
- State and local funding is equivalent to 3.07% of Mississippi’s taxpayer income.
- Federal education funding is equivalent to 0.93% of the state’s taxpayer income.
- Funding for K-12 education in Mississippi totals $5.72 billion or $13,000 per pupil.
- The difference between spending and funding is $265.9 million or $600 per pupil.
- At the postsecondary level, public colleges and universities spend $34,350 per pupil, 21.3% of which goes toward instruction.
- Federal funding for public postsecondary institutions averages $3,770 per student.
- State and local funding averages a combined $8,490 per student.
- Tuition accounts for 14.7% of all funding, which is a 5.52% smaller proportion than in the previous academic year.
- 7.11% of all postsecondary funding comes from sales and services of auxiliary enterprises.
- Mississippi’s 2-year community colleges spend 26.3% of what its 4-year public colleges spend in a year.
Public Education Spending in Missouri
Missouri ranks 34th in K-12 school spending and 36th in funding. Missouri schools spend less than the national average on education relative to taxpayer income.
- Missouri K-12 schools spend $14,700 per pupil for a total of $13.1 billion annually.
- Expenditures are equivalent to 3.40% of taxpayer income.
- Missouri K-12 schools receive $2.03 billion, or $2,270 per pupil, from the federal government.
- State funding totals $4.73 billion or $5,310 per pupil.
- Local funding totals $6.84 billion or $7,670 per pupil.
- State and local funding is equivalent to 3.00% of Missouri’s taxpayer income.
- Federal education funding is equivalent to 0.53% of the state’s taxpayer income.
- Funding for K-12 education in Missouri totals $13.6 billion or $15,250 per pupil.
- The difference between spending and funding is $485.2 million or $540 per pupil.
- At the postsecondary level, public colleges and universities spend $25,560 per pupil, 25.8% of which goes toward instruction.
- Federal funding for public postsecondary institutions averages $1,150 per student.
- State and local funding averages a combined $6,150 per student.
- Tuition accounts for 15.5% of all funding, which is a 22.4% smaller proportion than in the previous academic year.
- 12.2% of all postsecondary funding comes from sales and services of auxiliary enterprises.
- Missouri’s 2-year community colleges spend 16.8% of what its 4-year public colleges spend in a year.
Public Education Spending in Montana
Montana ranks 30th in K-12 school spending and 35th in funding. Schools in Montana spend less than the national average on education per pupil and as a proportion of taxpayer income.
- Montana K-12 schools spend $15,500 per pupil for a total of $2.34 billion annually.
- Expenditures are equivalent to 3.18% of taxpayer income.
- Montana K-12 schools receive $492.7 million, or $3,270 per pupil, from the federal government.
- State funding totals $931.9 million or $6,180 per pupil.
- Local funding totals $929.9 million or $6,170 per pupil.
- State and local funding is equivalent to 2.54% of Montana’s taxpayer income.
- Federal education funding is equivalent to 0.67% of the state’s taxpayer income.
- Funding for K-12 education in Montana totals $2.35 billion or $15,620 per pupil.
- There is a difference of $18.1 million or $120 per pupil between Montana school spending and funding.
- At the postsecondary level, public colleges and universities spend $29,360 per pupil, 25.7% of which goes toward instruction.
- Federal funding for public postsecondary institutions averages $6,280 per student.
- State and local funding averages a combined $7,860 per student.
- Tuition accounts for 23.5% of all funding, which is a 11.5% smaller proportion than in the previous academic year.
- 6.39% of all postsecondary funding comes from sales and services of auxiliary enterprises.
- Montana’s 2-year community colleges spend 10.2% of what its 4-year public colleges spend in a year.
Public Education Spending in Nebraska
Nebraska ranks 24th in K-12 school spending and 27th in funding. The state spends less per pupil and relative to taxpayer income.
- Nebraska K-12 schools spend $16,640 per pupil for a total of $5.48 billion annually.
- Expenditures are equivalent to 4.04% of taxpayer income.
- Nebraska K-12 schools receive $648.4 million, or $1,970 per pupil, from the federal government.
- State funding totals $1.61 billion or $4,880 per pupil.
- Local funding totals $3.09 billion or $9,400 per pupil.
- State and local funding is equivalent to 3.47% of Nebraska’s taxpayer income.
- Federal education funding is equivalent to 0.48% of the state’s taxpayer income.
- Funding for K-12 education in Nebraska totals $5.35 billion or $16,240 per pupil.
- Nebraska school spending exceeds funding by $131.4 million or $400 per pupil.
- At the postsecondary level, public colleges and universities spend $28,520 per pupil, 32.1% of which goes toward instruction.
- Federal funding for public postsecondary institutions averages $3,460 per student.
- State and local funding averages a combined $12,490 per student.
- Tuition accounts for 16.5% of all funding, a 5.67% smaller proportion than in the previous academic year.
- 8.56% of all postsecondary funding comes from sales and services of auxiliary enterprises.
- Nebraska’s 2-year community colleges spend 21.6% of what its 4-year public colleges spend in a year.
Public Education Spending in Nevada
Nevada K-12 schools rank 47th in spending and 46th in funding. State schools spend less per pupil than the nationwide average.
- Nevada K-12 schools spend $12,230 per pupil for a total of $5.92 billion annually.
- Expenditures are equivalent to 2.79% of taxpayer income.
- Nevada K-12 schools receive $993.4 million, or $2,050 per pupil, from the federal government.
- State funding totals $4.29 billion or $8,870 per pupil.
- Local funding totals $909.7 million or $1,880 per pupil.
- State and local funding is equivalent to 2.45% of Nevada’s taxpayer income.
- Federal education funding is equivalent to 0.47% of the state’s taxpayer income.
- Funding for K-12 education in Nevada totals $6.20 billion or $12,800 per pupil.
- The difference between spending and funding is $274.3 million or $570 per pupil.
- At the postsecondary level, public colleges and universities spend $18,080 per pupil, 40.8% of which goes toward instruction.
- Federal funding for public postsecondary institutions averages $1,990 per student.
- State and local funding averages a combined $5,950 per student.
- Tuition accounts for 22.8% of all funding, which is a 2.54% smaller proportion than in the previous academic year.
- 2.06% of all postsecondary funding in Nevada comes from sales and services of auxiliary enterprises.
Public Education Spending in New Hampshire
New Hampshire K-12 schools rank 7th in spending and 9th in funding. Most funding comes from local sources.
- New Hampshire schools spend $21,900 per pupil for a total of $3.70 billion annually.
- Expenditures are equivalent to 3.38% of taxpayer income.
- New Hampshire K-12 schools receive $321.2 million, or $1,900 per pupil, from the federal government.
- State funding totals $1.07 billion or $6,340 per pupil.
- Local funding totals $2.25 billion or $13,340 per pupil.
- State and local funding is equivalent to 3.03% of New Hampshire’s taxpayer income.
- Federal education funding is equivalent to 0.29% of the state’s taxpayer income.
- Funding for K-12 education in New Hampshire totals $3.65 billion or $21,590 per pupil.
- New Hampshire school spending exceeds funding by $52.2 million or $310 per pupil.
- At the postsecondary level, public colleges and universities spend $30,310 per pupil, 31.3% of which goes toward instruction.
- Federal funding for public postsecondary institutions averages $2,090 per student.
- State and local funding averages a combined $5,970 per student.
- Tuition accounts for 28.3% of all funding, a 24.9% smaller proportion compared to the previous academic year.
- 13.2% of all postsecondary funding comes from sales and services of auxiliary enterprises.
- New Hampshire’s 2-year community colleges spend 15.9% of what its 4-year public colleges spend in a year.
Public Education Spending in New Jersey
New Jersey receives relatively little K-12 educational financing from the federal government. The state’s schools rank 3rd in spending and 2nd in funding.
- New Jersey K-12 schools spend $26,560 per pupil for a total of $36.8 billion annually.
- Expenditures are equivalent to 4.82% of taxpayer income.
- New Jersey K-12 schools receive $2.81 billion, or $2,030 per pupil, from the federal government.
- State funding totals $17.0 billion or $12,280 per pupil.
- Local funding totals $18.1 billion or $13,110 per pupil.
- State and local funding is equivalent to 4.61% of New Jersey’s taxpayer income.
- Federal education funding is equivalent to 0.37% of the state’s taxpayer income.
- Funding for K-12 education in New Jersey totals $37.9 billion or $27,420 per pupil.
- The difference between spending and funding is $1.19 billion or $860 per pupil.
- At the postsecondary level, public colleges and universities spend $27,450 per pupil, 30.3% of which goes toward instruction.
- Federal funding for public postsecondary institutions averages $2,410 per student.
- State and local funding averages a combined $7,860 per student.
- Tuition accounts for 26.5% of all funding, which is a 13.9% smaller proportion than in the previous academic year.
- 2.30% of all postsecondary funding comes from sales and services of auxiliary enterprises.
- New Jersey’s 2-year community colleges spend 18.8% of what its 4-year public colleges spend in a year.
Public Education Spending in New Mexico
New Mexico K-12 schools rank 35th in spending and 31st in funding. Schools spend less per pupil than most other states, but taxpayers spend more on education than the nationwide average.
- New Mexico K-12 schools spend $14,690 per pupil for a total of $4.63 billion annually.
- Expenditures are equivalent to 3.98% of taxpayer income.
- New Mexico K-12 schools receive $880.4 million, or $2,790 per pupil, from the federal government.
- State funding totals $3.24 billion or $10,280 per pupil.
- Local funding totals $900.0 million or $2,850 per pupil.
- State and local funding is equivalent to 3.56% of New Mexico’s taxpayer income.
- Federal education funding is equivalent to 0.76% of the state’s taxpayer income.
- Funding for K-12 education in New Mexico totals $5.02 billion or $15,920 per pupil.
- The difference between spending and funding is $389.9 million or $1,240 per pupil.
- At the postsecondary level, public colleges and universities spend $53,050 per pupil, 12.3% of which goes toward instruction.
- Federal funding for public postsecondary institutions averages $4,800 per student.
- State and local funding averages a combined $12,190 per student.
- Tuition accounts for 6.40% of all funding, which is a 8.89% smaller proportion than in the previous academic year.
- 1.18% of all postsecondary funding comes from sales and services of auxiliary enterprises.
- New Mexico’s 2-year community colleges spend 17.2% of what its 4-year public colleges spend in a year.
Public Education Spending in New York
New York schools rank 1st in spending and in funding. Home to 5.10% of the nation’s K-12 students, the state receives 9.70% of all U.S. public primary school funding.
- New York K-12 schools spend $33,440 per pupil for a total of $84.7 billion annually.
- Expenditures are equivalent to 5.35% of taxpayer income.
- New York K-12 schools receive $6.17 billion, or $2,440 per pupil from the federal government.
- State funding totals $30.8 billion or $12,150 per pupil.
- Local funding totals $48.2 billion or $19,050 per pupil.
- State and local funding is equivalent to 4.99% of New York’s taxpayer income.
- Federal education funding is equivalent to 0.39% of the state’s taxpayer income.
- Funding for K-12 education in New York totals $85.2 billion or $33,640 per pupil.
- The difference between spending and funding is $501.9 million or $200 per pupil.
- At the postsecondary level, public colleges and universities spend $30,570 per pupil, 32.2% of which goes toward instruction.
- Federal funding for public postsecondary institutions averages $1,260 per student.
- State and local funding averages a combined $11,390 per student.
- Tuition accounts for 13.4% of all funding, a 7.27% smaller proportion than in the previous academic year.
- 2.36% of all postsecondary funding comes from sales and services of auxiliary enterprises.
- New York’s 2-year community colleges spend 20.9% of what its 4-year public colleges spend in a year.
Public Education Spending in North Carolina
North Carolina ranks 46th in K-12 school spending and 46th in funding. Schools spend much less per pupil and relative to taxpayer income than most other states.
- North Carolina K-12 schools spend $12,350 per pupil for a total of $19.0 billion annually.
- Expenditures are equivalent to 2.86% of taxpayer income.
- North Carolina K-12 schools receive $3.81 billion, or $2,470 per pupil, from the federal government.
- State funding totals $10.5 billion or $6,780 per pupil.
- Local funding totals $4.46 billion or $2,890 per pupil.
- State and local funding is 2.24% of North Carolina’s taxpayer income.
- Federal education funding is equivalent to 0.57% of the state’s taxpayer income.
- Funding for K-12 education in North Carolina totals $18.7 billion or $12,140 per pupil.
- North Carolina school spending exceeds funding by $322.1 million or $210 per pupil.
- At the postsecondary level, public colleges and universities spend $26,380 per pupil, 31.4% of which goes toward instruction.
- Federal funding for public postsecondary institutions averages $2,500 per student.
- State and local funding averages a combined $10,650.
- Tuition accounts for 12.8% of all funding, a 18.8% smaller proportion compared to the previous academic year.
- 10.4% of all postsecondary funding comes from sales and services of auxiliary enterprises.
- North Carolina’s 2-year community colleges spend 24.8% of what its 4-year public colleges spend in a year.
Public Education Spending in North Dakota
North Dakota K-12 schools rank 17th in spending and 18th in funding. On average, schools spend more per pupil and relative to taxpayer income.
- K-12 schools spend $18,490 per pupil for a total of $2.19 billion annually.
- Expenditures are equivalent to 3.79% of taxpayer income.
- North Dakota K-12 schools receive $402.1 million, or $3,390 per pupil, from the federal government.
- State funding totals $1.08 billion or $9,130 per pupil.
- Local funding totals $720.9 million or $6,080 per pupil.
- State and local funding is equivalent to 3.12% of North Dakota’s taxpayer income.
- Federal education funding is equivalent to 0.70% of the state’s taxpayer income.
- Funding for K-12 education in North Dakota totals $2.20 billion or $18,600 per pupil.
- The difference between spending and funding is $13.8 million or $120 per pupil.
- At the postsecondary level, public colleges and universities spend $29,830 per pupil, 33.5% of which goes toward instruction.
- Federal funding for public postsecondary institutions averages $3,730 per student.
- State and local funding averages a combined $9,370 per student.
- Tuition accounts for 25.7% of all funding, a 8.45% smaller proportion than in the previous academic year.
- 6.34% of all postsecondary funding comes from sales and services of auxiliary enterprises.
- North Dakota’s 2-year community colleges spend 9.50% of what its 4-year public colleges spend in a year.
Public Education Spending in Ohio
Ohio K-12 schools rank 23rd in spending and funding. Spending per pupil is on par with the national average, but schools spend a little more relative to taxpayer income.
- K-12 schools spend $16,690 per pupil for a total of $28.05 billion annually.
- Expenditures are equivalent to 3.88% of taxpayer income.
- Ohio K-12 schools receive $3.98 billion , or $2,370 per pupil, from the federal government.
- State funding totals $9.74 billion or $5,800 per pupil.
- Local funding totals $14.8 billion or $8,880 per pupil.
- State and local funding is equivalent to 3.40% of Ohio’s taxpayer income.
- Federal education funding is equivalent to 0.55% of the state’s taxpayer income.
- Funding for K-12 education in Ohio totals $28.5 billion or $16,960 per pupil.
- Ohio school spending exceeds funding by $458.7 million or $270 per pupil.
- At the postsecondary level, public colleges and universities spend $25,270 per pupil, 30.4% of which goes toward instruction.
- Federal funding for public postsecondary institutions averages $1,670 per student.
- State and local funding averages a combined $5,900 per student.
- Tuition accounts for 18.9% of all funding, which is a 21.4% smaller proportion compared to the previous academic year.
- 3.03% of all postsecondary funding comes from sales and services of auxiliary enterprises.
- Ohio’s 2-year community colleges spend 7.91% of what its 4-year public colleges spend in a year.
Public Education Spending in Oklahoma
Oklahoma K-12 schools rank 48th in spending and in funding. The state’s schools spend much less per pupil than most other states.
- K-12 schools spend $11,350 per pupil for a total of $7.96 billion annually.
- Expenditures are equivalent to 3.31% of taxpayer income.
- Oklahoma K-12 schools receive $1.63 billion, or $2,330 per pupil, from the federal government.
- State funding totals $3.48 billion or $4,970 per pupil.
- Local funding totals $3.24 billion or $4,620 per pupil.
- State and local funding is equivalent to 2.80% of Oklahoma’s taxpayer income.
- Federal education funding is equivalent to 0.68% of the state’s taxpayer income.
- Funding for K-12 education in Oklahoma totals $8.36 billion or $11,920 per pupil.
- Oklahoma school spending exceeds funding by $397.5 million or $570 per pupil.
- At the postsecondary level, public colleges and universities spend $27,370 per pupil, 30.5% of which goes toward instruction.
- Federal funding for public postsecondary institutions averages $2,510 per student.
- State and local funding averages a combined $6,960 per student.
- Tuition accounts for 21.8% of all funding, which is a 3.07% smaller proportion compared to the previous academic year.
- 9.49% of all postsecondary funding comes from sales and services of auxiliary enterprises.
- Oklahoma’s 2-year community colleges spend 12.9% of what its 4-year public colleges spend in a year.
Public Education Spending in Oregon
Oregon K-12 schools rank 15th in spending and 19th in funding. Oregon spends more on public postsecondary education than most other states.
- K-12 schools spend $19,380 per pupil for a total of $11.2 billion annually.
- Expenditures are equivalent to 3.99% of taxpayer income.
- Oregon K-12 schools receive $1.16 billion, or $2,010 per pupil, from the federal government.
- State funding totals $5.63 billion or $9,750 per pupil.
- Local funding totals $3.87 billion or $6,700 per pupil.
- State and local funding is equivalent to 3.38% of Oregon’s taxpayer income.
- Federal education funding is equivalent to 0.41% of the state’s taxpayer income.
- Funding for K-12 education in Oregon totals $10.7 billion or $18,460 per pupil.
- Oregon school spending exceeds funding by $531.2 million or $920 per pupil.
- At the postsecondary level, public colleges and universities spend $47,120 per pupil, 19.7% of which goes toward instruction.
- Federal funding for public postsecondary institutions averages $5,470 per student.
- State and local funding averages a combined $8,750 per student.
- Tuition accounts for 15.2% of all funding, which is a 4.41% smaller proportion than in the previous academic year.
- 4.02% of all postsecondary funding comes from sales and services of auxiliary enterprises.
- Oregon’s 2-year community colleges spend 18.5% of what its 4-year public colleges spend in a year.
Public Education Spending in Pennsylvania
Pennsylvania K-12 schools rank 9th in spending and 7th in funding. Schools in Pennsylvania spend more per pupil and relative to taxpayer income.
- K-12 schools spend $21,440 per pupil for a total of $36.3 billion annually.
- Expenditures are equivalent to 4.08% of taxpayer income.
- Pennsylvania K-12 schools receive $4.67 billion, or $2,760 per pupil, from the federal government.
- State funding totals $13.3 billion or $7,880 per pupil.
- Local funding totals $19.6 billion or $11,560 per pupil.
- State and local funding is equivalent to 3.70% of Pennsylvania’s taxpayer income.
- Federal education funding is equivalent to 0.52% of the state’s taxpayer income.
- Funding for K-12 education in Pennsylvania totals $37.6 billion or $22,200 per pupil.
- The difference between spending and funding is $1.29 billion or $760 per pupil.
- At the postsecondary level, public colleges and universities spend $43,240 per pupil, 20.7% of which goes toward instruction.
- Federal funding for public postsecondary institutions averages $4,380 per student.
- State and local funding averages a combined $5,700 per student.
- Tuition accounts for 21.0% of all funding, a 23.0% smaller proportion compared to the previous academic year.
- 2.53% of all postsecondary funding comes from sales and services of auxiliary enterprises.
- Pennsylvania’s 2-year community colleges spend 7.83% of what its 4-year public colleges spend in a year.
Public Education Spending in Rhode Island
Rhode Island K-12 schools rank 10th in spending and 13th in funding. Rhode Island spends more on K-12 education and less on public postsecondary education relative to the national averages.
- K-12 schools spend $21,050 per pupil for a total of $2.89 billion annually.
- Expenditures are equivalent to 3.90% of taxpayer income.
- Rhode Island K-12 schools receive $335.0 million, or $2,440 per pupil, from the federal government.
- State funding totals $1.14 billion or $8,260 per pupil.
- Local funding totals $1.40 billion or $10,180 per pupil.
- State and local funding is equivalent to 3.41% of Rhode Island’s taxpayer income.
- Federal education funding is equivalent to 0.45% of the state’s taxpayer income.
- Funding for K-12 education in Rhode Island totals $2.87 billion or $20,880 per pupil.
- Rhode Island spending exceeds the funding by $24.0 million or $170 per pupil.
- At the postsecondary level, public colleges and universities spend $22,680 per pupil, 32.5% of which goes toward instruction.
- Federal funding for public postsecondary institutions averages $3,360 per student.
- State and local funding averages a combined $5,550 per student.
- Tuition accounts for 36.6% of all funding, which is an 2.89% larger proportion compared to the previous academic year.
- 8.10% of all postsecondary funding comes from sales and services of auxiliary enterprises.
- Rhode Island’s 2-year community colleges spend 17.8% of what its 4-year public colleges spend in a year.
Public Education Spending in South Carolina
South Carolina K-12 schools rank 33rd in spending and in funding. South Carolina spends less on K-12 and on postsecondary education than most other states.
- K-12 schools spend $14,880 per pupil for a total of $11.8 billion annually.
- Expenditures are equivalent to 3.82% of taxpayer income.
- South Carolina K-12 schools receive $1.91 billion, or $2,420 per pupil, from the federal government.
- State funding totals $5.43 billion or $6,880 per pupil.
- Local funding totals $5.21 billion or $6,660 per pupil.
- State and local funding is equivalent to 3.46% of South Carolina’s taxpayer income.
- Federal education funding is equivalent to 0.62% of the state’s taxpayer income.
- Funding for K-12 education in South Carolina totals $12.6 billion or $15,910 per pupil.
- The difference between spending and funding is $807.6 million or $1,020 per pupil.
- At the postsecondary level, public colleges and universities spend $28,030 per pupil, 33.2% of which goes toward instruction.
- Federal funding for public postsecondary institutions averages $2,850 per student.
- State and local funding averages a combined $7,450 per student.
- Tuition accounts for 31.0% of all funding, a 4.50% smaller proportion compared to the previous academic year.
- 8.22% of all postsecondary funding comes from sales and services of auxiliary enterprises.
- South Carolina’s 2-year community colleges spend 16.4% of what its 4-year public colleges spend in a year.
Public Education Spending in South Dakota
South Dakota K-12 schools rank 40th in spending and in funding. South Dakota receives more federal funding per student than most other states, but K-12 spending per pupil is lower than most other states.
- K-12 schools spend $13,640 per pupil for a total of $1.93 billion annually.
- Expenditures are equivalent to 2.96% of taxpayer income.
- South Dakota K-12 schools receive $433.1 million, or $3,050 per pupil, from the federal government.
- State funding totals $612.0 million or $4,310 per pupil.
- Local funding totals $953.7 million or $6,720 per pupil.
- State and local funding is equivalent to 2.40% of South Dakota’s taxpayer income.
- Federal education funding is equivalent to 0.66% of the state’s taxpayer income.
- Funding for K-12 education in South Dakota totals $2.00 billion or $14,090 per pupil.
- The difference between spending and funding is $64.0 million or $450 per pupil.
- At the postsecondary level, public colleges and universities spend $20,810 per pupil, 32.8% of which goes toward instruction.
- Federal funding for public postsecondary institutions averages $3,440 per student.
- State and local funding averages a combined $6,410 per student.
- Tuition accounts for 24.4% of all funding, a 9.70% smaller proportion compared to the previous academic year.
- 6.51% of all postsecondary funding comes from sales and services of auxiliary enterprises.
- South Dakota’s 2-year community colleges spend 12.3% of what its 4-year public colleges spend in a year.
Public Education Spending in Tennessee
Tennessee K-12 schools rank 43rd in spending and in funding. Tennessee K-12 and postsecondary schools spend much less in education per pupil than the average U.S. school.
- K-12 schools spend $12,430 per pupil for a total of $12.5 billion annually.
- Expenditures are equivalent to 2.84% of taxpayer income.
- Tennessee K-12 schools receive $2.55 billion, or $2,540 per pupil, from the federal government.
- State funding totals $5.43 billion or $5,390 per pupil.
- Local funding totals $5.43 billion or $5,390 per pupil.
- State and local funding is equivalent to 2.46% of Tennessee’s taxpayer income.
- Federal education funding is the equivalent to 0.58% of the state’s taxpayer income.
- Funding for K-12 education in Tennessee totals $13.4 billion or $13,320 per pupil.
- The difference between spending and funding is $898.6 million or $890 per pupil.
- At the postsecondary level, public colleges and universities spend $23,180 per pupil, 37.3% of which goes toward instruction.
- Federal funding for public postsecondary institutions averages $1,510 per student.
- State and local funding averages a combined $8,710 per student.
- Tuition accounts for 20.1% of all funding, a 7.79% smaller proportion than in the previous academic year.
- 5.47% of all postsecondary funding comes from sales and services of auxiliary enterprises.
- Tennessee’s 2-year community colleges spend 18.7% of what its 4-year public colleges spend in a year.
Public Education Spending in Texas
Texas K-12 schools rank 37th in spending and 42nd in funding. Texas is second only to California in the size of its K-12 student population.
- K-12 schools spend $14,260 per pupil for a total of $78.7 billion annually.
- Expenditures are equivalent to 3.87% of taxpayer income.
- Texas K-12 schools receive $13.4 billion, or $2,430 per pupil, from the federal government.
- State funding totals $23.0 billion or $4,180 per pupil.
- Local funding totals $37.8 billion or $6,850 per pupil.
- State and local funding is equivalent to 3.00% of Texas’ taxpayer income.
- Federal education funding is equivalent to 0.66% of the state’s taxpayer income.
- Funding for K-12 education in Texas totals $74.3 billion or $13,450 per pupil.
- Texas school spending exceeds funding by $4.43 billion or $800 per pupil.
- At the postsecondary level, public colleges and universities spend $29,200 per pupil, 27.6% of which goes toward instruction.
- Federal funding for public postsecondary institutions averages $2,340 per student.
- State and local funding averages a combined $8,610 per student.
- Tuition accounts for 10.3% of all funding, a 27.5% smaller proportion compared to the previous academic year.
- 1.94% of all postsecondary funding comes from sales and services of auxiliary enterprises.
- Texas’ 2-year community colleges spend 8.98% of what its 4-year public colleges spend in a year.
Public Education Spending in Utah
Utah K-12 schools rank 50th in spending and 51st in funding.
- K-12 schools spend $9,980 per pupil for a total of $6.90 billion annually.
- Expenditures are equivalent to 3.15% of taxpayer income.
- Utah K-12 schools receive $907.3 million, or $1,310 per pupil, from the federal government.
- State funding totals $3.40 billion or $4,920 per pupil.
- Local funding totals $2.82 billion or $4,070 per pupil.
- State and local funding is equivalent to 2.84% of Utah’s taxpayer income.
- Federal education funding is equivalent to 0.41% of the state’s taxpayer income.
- Funding for K-12 education in Utah totals $7.12 billion or $10,300 per pupil.
- The difference between spending and funding is $221.0 million or $320 per pupil.
- At the postsecondary level, public colleges and universities spend $43,280 per pupil, 15.1% of which goes toward instruction.
- Federal funding for public postsecondary institutions averages $3,520 per student.
- State and local funding averages a combined total of $7,270 per student.
- Tuition accounts for 10.0% of all funding, a 15.7% smaller proportion compared to the previous academic year.
- 2.18% of all postsecondary funding comes from sales and services of auxiliary enterprises.
- Utah’s 2-year community colleges spend 2.85% of what its 4-year public colleges spend in a year.
Public Education Spending in Vermont
Vermont K-12 schools rank 2nd in spending and 3rd in funding.
- K-12 schools spend $26,970 per pupil for a total of $2.26 billion annually.
- Expenditures are equivalent to 5.20% of taxpayer income.
- Vermont K-12 schools receive $240.4 million, or $2,870 per pupil, from the federal government.
- State funding totals $2.00 billion or $23,890 per pupil.
- Local funding totals $48.2 million or $580 per pupil.
- State and local funding is equivalent to 4.72% of Vermont’s taxpayer income.
- Federal education funding is equivalent to 0.55% of the state’s taxpayer income.
- Funding for K-12 education in Vermont totals $2.29 billion or $27,340 per pupil.
- The difference between spending and funding is $31.0 million or $370 per pupil.
- At the postsecondary level, public colleges and universities spend $37,820 per pupil, 25.7% of which goes toward instruction.
- Federal funding for public postsecondary institutions averages $6,600 per student.
- State and local funding averages a combined $8,620 per student.
- Tuition accounts for 35.6% of all funding, a 21.2% smaller proportion compared to the previous academic year.
- 7.99% of all postsecondary funding comes from sales and services of auxiliary enterprises.
- Vermont’s 2-year community colleges spend 3.60% of what its 4-year public colleges spend in a year.
Public Education Spending in Virginia
Virginia K-12 schools rank 26th in spending and 25th in funding. The state receives very little educational financing from the federal government.
- K-12 schools spend $16,440 per pupil for a total of $20.7 billion annually.
- Expenditures are equivalent to 3.21% of taxpayer income.
- Virginia K-12 schools receive $2.55 billion, or $2,020 per pupil, from the federal government.
- State funding totals $8.14 billion or $8,110 per pupil.
- Local funding totals $10.2 billion or $8,110 per pupil.
- State and local funding is equivalent to 2.85% of Virginia’s taxpayer income.
- Federal education funding is equivalent to 0.39% of the state’s taxpayer income.
- Funding for K-12 education in Virginia totals $20.9 billion or $16,590 per pupil.
- The difference between spending and funding is $183.4 million or $150 per pupil.
- At the postsecondary level, public colleges and universities spend $30,550 per pupil, 28.3% of which goes toward instruction.
- Federal funding for public postsecondary institutions averages $2,840 per student.
- State and local funding averages a combined $6,290 per student.
- Tuition accounts for 19.3% of all funding, a 24.4% smaller proportion compared to the previous academic year.
- 7.18% of all postsecondary funding comes from sales and services of auxiliary enterprises.
- Virginia’s 2-year community colleges spend 11.0% of what its 4-year public colleges spend in a year.
Public Education Spending in Washington
The state ranks 11th in school spending and 15th in funding. Schools in Washington spend more per pupil compared to schools nationwide.
- K-12 schools spend $20,750 per pupil for a total of $22.6 billion annually.
- Expenditures are equivalent to 3.58% of taxpayer income.
- Washington K-12 schools receive $2.69 billion, or $2,470 per pupil, from the federal government.
- State funding totals $13.8 billion or $12,680 per pupil.
- Local funding totals $5.33 billion or $4,890 per pupil.
- State and local funding is equivalent to 3.03% of Washington’s taxpayer income.
- Federal education funding is equivalent to 0.43% of the state’s taxpayer income.
- Funding for K-12 education in Washington totals $21.9 billion or $20,040 per pupil.
- Washington school spending exceeds funding by $771.4 million or $710 per pupil.
- At the postsecondary level, public colleges and universities spend $32,270 per pupil, 31.0% of which goes toward instruction.
- Federal funding for public postsecondary institutions averages $5,020 per student.
- State and local funding averages a combined $10,680 per student.
- Tuition accounts for 15.4% of all funding, a 18.0% smaller proportion compared to the previous academic year.
- 3.55% of all postsecondary funding comes from sales and services of auxiliary enterprises.
- Washington’s 2-year community colleges spend 2.76% of what its 4-year public colleges spend in a year.
Public Education Spending in West Virginia
West Virginia K-12 schools rank 31st in spending and 30th in funding. Schools in West Virginia spend much more relative to local taxpayer income compared to the average school nationwide.
- K-12 schools spend $15,360 per pupil for a total of $3.86 billion annually.
- Expenditures are equivalent to 4.11% of taxpayer income.
- West Virginia K-12 schools receive $747.1 million, or $2,970 per pupil, from the federal government.
- State funding totals $1.90 billion or $7,540 per pupil.
- Local funding totals $1.38 billion or $5,490 per pupil.
- State and local funding is equivalent to 3.48% of West Virginia’s taxpayer income.
- Federal education funding is equivalent to 0.679% of the state’s taxpayer income.
- Funding for K-12 education in West Virginia totals $4.02 billion, or $16,010 per pupil.
- The difference between spending and funding is $164.2 million, or $650 per pupil.
- At the postsecondary level, public colleges and universities spend $26,050 per pupil, 31.9% of which goes toward instruction.
- Federal funding for public postsecondary institutions averages $2,120 per student.
- State and local funding averages a combined $9,260 per student.
- Tuition accounts for 27.9% of all funding, a 11.5% smaller proportion compared to the previous academic year.
- 7.29% of all postsecondary funding comes from sales and services of auxiliary enterprises.
- West Virginia’s 2-year community colleges spend 9.24% of what its 4-year public colleges spend in a year.
Public Education Spending in Wisconsin
Wisconsin K-12 schools receive relatively little from the federal government. The state ranks 22nd in spending and in funding. Wisconsin K-12 and postsecondary schools spend slightly less per pupil than the nationwide average.
- K-12 schools spend $16,740 per pupil for a total of $13.8 billion annually.
- Expenditures are equivalent to 3.59% of taxpayer income.
- Wisconsin K-12 schools receive $1.63 billion, or $1,990 per pupil, from the federal government.
- State funding totals $7.39 billion or $8,970 per pupil.
- Local funding totals $5.13 billion or $6,230 per pupil.
- State and local funding is equivalent to 3.26% of Wisconsin’s taxpayer income.
- Federal education funding is equivalent to 0.43% of the state’s taxpayer income.
- Funding for K-12 education in Wisconsin totals $14.2 billion or $17,190 per pupil.
- The difference between spending and funding is $370.1 million or $450 per pupil.
- At the postsecondary level, public colleges and universities spend $25,010 per pupil, 35.1% of which goes toward instruction.
- Federal funding for public postsecondary institutions averages $2,930 per student.
- State and local funding averages a combined $9,450 per student.
- Tuition accounts for 21.5% of all funding, a 5.15% smaller proportion compared to the previous academic year.
- 4.01% of all postsecondary funding comes from sales and services of auxiliary enterprises.
- Wisconsin’s 2-year community colleges spend 22.1% of what its 4-year public colleges spend in a year.
Public Education Spending in Wyoming
Wyoming spends more than average on K-12 education in terms of percentage of taxpayers’ personal income. The state’s schools rank 12th in spending and 8th in funding.
- Wyoming K-12 schools spend $20,160 per pupil for a total of $1.86 billion annually.
- Expenditures are equivalent to 4.03% of taxpayer income.
- K-12 schools receive $265.9 million, or $2,880 per pupil, from the federal government.
- State funding totals $1.07 billion or $11,550 per pupil.
- Local funding totals $715.8 million or $7,740 per pupil.
- State and local funding is equivalent to 3.86% of Wyoming’s taxpayer income.
- Federal education funding is equivalent to 0.57% of the state’s taxpayer income.
- Funding for K-12 education in Wyoming totals $2.05 billion or $22,170 per pupil.
- The difference between spending and funding is $186.1 million or $2,010 per pupil.
- At the postsecondary level, public colleges and universities spend $30,590 per pupil, 29.5% of which goes toward instruction.
- Federal funding for public postsecondary institutions averages $3,470 per student.
- State and local funding averages a combined $14,150 per student.
- Tuition accounts for 9.61% of all funding, a 28.5% smaller proportion compared to the previous academic year.
- 3.14% of all postsecondary funding comes from sales and services of auxiliary enterprises.
- Wyoming’s 2-year community colleges spend 17.8% of what its 4-year public colleges spend in a year.
Sources
- National Center for Education Statistics, Digest of Education
- United States Census Bureau, Annual Survey of School System Finances
- United States Department of Commerce Bureau of Economic Analysis, Data
- Organization for Economic Co-operation and Development (OECD), Statistical Resources
- UNESCO Institute for Statistics Database, Education Statistics
- United States Department of Education, Budget History Tables