


Studies in type 1 diabetes indicate potential disease heterogeneity, notably in the rate of β-cell loss, responsiveness to immunotherapies, and, in limited studies, islet pathology. We sought evidence for different immunological phenotypes using two approaches. First, we defined blood autoimmune response phenotypes by combinatorial, multiparameter analysis of autoantibodies and autoreactive T-cell responses in 33 children/adolescents with newly diagnosed diabetes. Multidimensional cluster analysis showed two equal-sized patient agglomerations characterized by proinflammatory (interferon-γ–positive, multiautoantibody-positive) and partially regulated (interleukin-10–positive, pauci-autoantibody–positive) responses. Multiautoantibody-positive nondiabetic siblings at high risk of disease progression showed similar clustering. Additionally, pancreas samples obtained post mortem from a separate cohort of 21 children/adolescents with recently diagnosed type 1 diabetes were examined immunohistologically. This revealed two distinct types of insulitic lesions distinguishable by the degree of cellular infiltrate and presence of B cells that we termed “hyper-immune CD20Hi” and “pauci-immune CD20Lo.” Of note, subjects had only one infiltration phenotype and were partitioned by this into two equal-sized groups that differed significantly by age at diagnosis, with hyper-immune CD20Hi subjects being 5 years younger. These data indicate potentially related islet and blood autoimmune response phenotypes that coincide with and precede disease. We conclude that different immunopathological processes (endotypes) may underlie type 1 diabetes, carrying important implications for treatment and prevention strategies.
Introduction
Type 1 diabetes is a chronic inflammatory disease resulting from selective immune-mediated destruction of insulin-producing β-cells in the islets of Langerhans (1). Numerous features of the syndrome are constant, including an absolute requirement for exogenous insulin administration, and in the narrower definition of type 1A diabetes, evidence of ongoing autoimmunity directed against the islets (2). The latter is usually manifest through circulating islet antigen-specific autoantibodies (islet AAbs), but now there is considerable evidence that circulating autoreactive CD4 and CD8 T cells are also detectable (3–7). These insights have been critical in the translational course of immune-based therapies aiming to subvert or incapacitate immune pathways that lead to β-cell death.
In most intervention studies to date, the major inclusion criterion is positivity for a single-islet AAb, of any specificity. In light of recent suggestions that type 1 diabetes is heterogeneous in nature, this aspect of clinical trial design is worth closer inspection. For example, evidence suggests that patients present with varying levels of functional β-cell reserve and rate of loss (8) as well as with varying number and type of AAbs (9). There is also an emerging impression that islet pathology, in terms of extent of β-cell damage and immune cell infiltration, may have a broad range of presentations, although data in this regard are currently very limited (10). If these observations of clinico-pathological heterogeneity reflect diverse immunological pathways to disease, then this could have important implications for the selection and testing of agents designed to halt ongoing immune-mediated damage.
We previously described circulating CD4 T cells specific for islet autoantigens and secreting inflammatory cytokines (interferon-γ [IFN-γ], interleukin [IL]-17) as a characteristic of type 1 diabetes (4,6). Those studies provided proof of concept that autoreactive T cells are present at disease diagnosis, but there have been limited attempts to date to link this finding to the presence of islet AAbs and gain a more holistic view of the adaptive immune response. Because patients with type 1 diabetes may have absent, single, or multiple islet-specific autoantibodies at diagnosis, this broader view of the autoimmune response may offer insights into the nature of this heterogeneity.
From these considerations, we identified two important and potentially linked knowledge gaps. The first is whether there are distinct patterns of the adaptive autoimmune response detectable in the blood that can be revealed in combinatorial approaches, and the second is whether there is evidence of heterogeneity of islet pathology. To address these knowledge gaps, we combined measurements of autoimmunity (functional phenotype of autoreactive CD4 T cells and islet AAbs) with multidimensional data analysis to explore whether distinct autoimmune response phenotypes are present in children with type 1 diabetes and how they relate to disease risk in siblings. In addition, we profiled the islet immune cell infiltration in a cohort of children who died close to type 1 diabetes diagnosis. The data provide evidence for distinct immunopathological processes in type 1 diabetes development, which may have important implications for intervention and prevention strategies.
Research Design and Methods
Autoantibody Assays
Insulin autoantibody (IAA), GAD65 antibody (GADAb), islet antigen antibodies (IA-2Ab), and zinc transporter 8 antibody (ZnT8Ab) were measured by radioimmunoassay as previously described (11,12). IAA and ZnT8Ab levels were expressed in arbitrary units and GADAb and IA-2Ab in DK units/mL (digestive and kidney units) (12).
Studies on Peripheral Blood
Fresh heparinized blood samples were obtained from 33 children with type 1 diabetes (median age 11 years [range 5–16 years], duration of type 1 diabetes ≤12 weeks [median 8 weeks], 60% males). Positivity for AAbs was as follows: GADAb, 54%; IA-2Ab, 73%; and ZnT8Ab, 65%. IAA measurements were not conducted in patients with type 1 diabetes. In addition, blood samples were obtained from unaffected siblings of patients with type 1 diabetes within a similar age range (n = 72; median age 13 years [range 6–16 years]). Forty-four siblings were negative for all AAbs, 10 had a single AAb, 5 were positive for two AAbs, 7 were positive for three AAbs, and 3 had all four AAbs. A further three subjects were recruited through the Type 1 Diabetes TrialNet Pathway to Prevention study (TN-01) (median age 16 years [range 12–18 years], one subject positive for a single AAb, two positive for two AAbs). To avoid bias in CD4 T-cell responses due to varied possession of HLA class II molecules, only participants with one or both of the HLA-DRB1*0301 and *0401 genotypes were enrolled. In our previous studies, the frequency of responses to IA-2, proinsulin, and GAD65 peptides has not been significantly different between HLA-DRB1*0301 and *0401 subjects (6,13). Of subjects available for study, 12 children/adolescents with type 1 diabetes and 33 unaffected siblings were excluded on the basis of not having the HLA-DRB1*0301 or *0401 genotype. These studies were carried out with the approval of the U.K. National Research Ethics Service, and for blood studies, informed consent was obtained from all participants or their parents/guardians.
Detection of β-Cell–Specific Cytokine-Secreting CD4+ T Cells
Peptides based on sequences of naturally processed and presented IA-2, proinsulin, and GAD65 epitopes and overlapping regions of insulin B and A chains were synthesized and purified by high-performance liquid chromatography (Thermo Hybaid, Germany). Pediacel, a penta-vaccine, was obtained from Sanofi Pasteur Ltd. (Berkshire, U.K.) and used at 1 μL/mL to examine anamnestic responses induced by vaccination or infection as previously described (4). Detection of IFN-γ and IL-10 production by CD4+ T cells was carried out by using an enzyme-linked immunospot assay as previously described (6,13) and performed while blinded to the clinical status of the donor (type 1 diabetic or sibling, AAbs or not). Data are expressed as the mean number of spots per triplicate and compared with the mean spot number in the presence of diluent alone (stimulation index [SI]), and a response is considered positive when the SI is ≥3 (6). IFN-γ responses to Pediacel were similar in patients with type 1 diabetes and unaffected siblings (mean SI 79.7 vs. 78.8, respectively) as were IL-10 responses (mean SI 20.5 vs. 26.7, respectively).
Studies on Islet-Infiltrating Leukocytes
Formalin-fixed paraffin-embedded pancreas samples from 21 patients with type 1 diabetes from a previously described cohort (14) were included in the current study on the basis of confirmed insulitis, as defined in a recent position statement (10). The median age of these patients was 12 years (range 1–23 years) at disease onset and the median disease duration was 1 week (range 1 day to 6 months). Sections of pancreas (4 µm) were mounted on glass slides previously coated with (3-aminopropyl)-triethoxysilane (Sigma, Dorset, U.K.) then dewaxed and rehydrated in alcohol. Antigens were visualized by standard horseradish peroxidase staining and, with the exception of insulin, were unmasked using heat-induced epitope retrieval (HIER). For CD45 and CD20, HIER was achieved in 10 mmol/L citrate buffer, whereas CD4, CD8, and CD68 were retrieved with 10 mmol/L Tris and 1 mmol/L EDTA (pH 9.0). Primary antibodies where applied for 1 h at room temperature, except for CD4, which required overnight incubation at 4°C. Antigens were visualized using the Dako REAL Detection System and analyzed by light microscopy. Ten insulin-containing islet sections were selected at random from each patient, and the individual immune cell numbers per islet section were monitored by visual inspection of immunostained serial sections and recorded manually. Two additional cases were selected for study from within the JDRF Network for Pancreatic Organ Donors with Diabetes (nPOD) on the basis of being the only samples in the bioresource from patients with recent-onset diabetes (≤12 months). These cases (6113 and 6052) were examined by a combination of immunofluorescence, horseradish peroxidase, and alkaline phosphatase staining for at least two antigens per section to minimize sample usage. Antigens were unmasked by HIER in 10 mmol/L citrate buffer (pH 6). Combined staining was achieved by using guinea pig anti-insulin (#A056401; Dako) in sequence with mouse anti-CD45 (#M0701; Dako); rabbit antiglucagon (#A0565; Dako) after mouse anti-CD20 (#M0755; Dako); and mouse anti-CD68 (#M0876; Dako) with rabbit anti-CD8 (#ab4055; Abcam). Secondary antibodies were labeled with DyLight 405 (anti–guinea pig 405, #106-475-003-JIR; Stratech Scientific Ltd., Suffolk, U.K.), Alexafluor anti-mouse 488 (#A11029; Invitrogen, Paisley, U.K.), or anti-rabbit 568 (#A1136; Invitrogen). Alkaline phosphatase was detected using a Vector Red Substrate kit (#AK-5100 and #SK-5100; Vector Laboratories, U.K.), and cell nuclei were stained with TO-PRO-3 iodide (red) (#T3605; Invitrogen) or DAPI (blue). Immunofluorescence and bright field images were captured on a Nikon 80i and Nikon Eclipse 50i microscope, respectively.
Statistical Analysis
T-cell response data were aggregated for an autoantigen (proinsulin, insulin, GAD65, IA-2), and if any of the derivative peptides elicited a response, this autoantigen was considered positive. If responses to derivatives were positive but any relevant test condition (peptide, IFN-γ, IL-10) for the same antigen was missing, the autoantigen test value was considered positive, and the subject was included in the analysis. If responses to derivatives were negative but any relevant test condition for the same antigen was missing, the autoantigen test value was considered missing, and the subject was excluded from the analysis. A total of 33 children/adolescents with type 1 diabetes of 55 tested and 72 unaffected siblings of 97 tested were included in the analyses. The prevalence of positive responses was established with 95% CIs and compared by using Fisher exact test. Clustering was analyzed by agglomerative hierarchical clustering with Ward’s method based on squared Euclidean distance between tests/patients. Support for clusters was estimated by multiscale bootstrap resampling with 1,000 replications, implemented in the R package pvclust (15). Principal component analysis (PCA) was performed using unscaled binary data with standard R functions on healthy siblings positive for at least two AAbs, and rotation values from this data set were applied to samples from children/adolescents with type 1 diabetes. Differences in immune cell infiltration into islet sections were assessed by Mann-Whitney U test. Data were analyzed with GraphPad Prism 5 software or in statistical software environment R. P < 0.05 was considered statistically significant.
Results
Autoimmune Inflammatory Phenotypes in Children With Newly Diagnosed Type 1 Diabetes
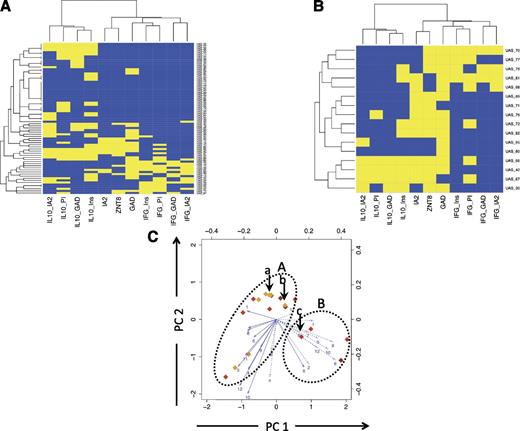
Blood samples from 33 children with newly diagnosed type 1 diabetes were analyzed for the quality (IFN-γ, IL-10, and AAbs) and specificity (proinsulin, insulin, IA-2, GAD65, and ZnT8) of autoimmune responses in a combinatorial approach. This analysis generated results for 27 analytes (3 AAbs, 12 islet peptides each tested for 2 cytokines), which in the case of the T-cell responses, were combined to show responsiveness to the parent antigens (Table 1). Analysis of these data by agglomerative hierarchical clustering showed the formation of two highly stable autoimmune response clusters (bootstrap support for the main nodes ≥95%) (Fig. 1A) representing 1) a combination of islet AAbs and IFN-γ responses to all antigens as distinct from 2) IL-10 responses to all antigens. In the same analysis, patients with type 1 diabetes formed two distinct clusters (bootstrap support for the main nodes >97%) (Fig. 1B) of approximately equal size.
Autoantigens and derivative peptide epitopes tested in T-cell assays
| Parent antigen | Region | Sequence | Relevant T-cell studies | Designation in analyses |
|---|---|---|---|---|
| Insulin (A + B chains) | A1–21 | GIVEQCCTSICSLYQLENYCNK | N/A | Ins (1) |
| B1–20 | FVNQHLCGSHLVEALYLVCGK | N/A | Ins (2) | |
| B6–25 | LCGSHLVEALYLVCGERGFFK | N/A | Ins (3) | |
| B11–30 | LVEALYLVCGERGFFYTPKTK | N/A | Ins (4) | |
| Proinsulin | C13–32 | GGGPGAGSLQPLALEGSLQK | 6 | PI (5) |
| C19-A3 | GSLQPLALEGSLQKRGIV | 4,6,13 | PI (6) | |
| C22-A5 | QPLALEGSLQKRGIVEQ | 6 | PI (7) | |
| IA-2 | 709–736 | LAKEWQALCAYQAEPNTCATAQGEGNIK | 4,6,13 | IA-2 (8) |
| 752–775 | KLKVESSPSRSDYINASPIIEHDP | 4,6,13 | IA-2 (9) | |
| 853–872 | SFYLKNVQTQETRTLTQFHF | 4,6,13 | IA-2 (10) | |
| GAD65 | 335–352 | TAGTTVYGAFDPLLAVAD | 4,13 | GAD (11) |
| 555–567 | NFIRMVISNPAAT | 4 | GAD (12) |
Ins, insulin; PI, proinsulin.

Cluster analysis of autoreactive T-cell and AAb responses in the blood close to diagnosis of type 1 diabetes. Blood samples from 33 children with newly diagnosed type 1 diabetes were analyzed for the quality (IFN-γ, IL-10, and AAbs) and specificity (proinsulin, insulin, IA-2, GAD65, and ZnT8) of autoimmune responses, generating results for 27 analytes summed to show responsiveness to the parent antigens. A: Dendrogram showing agglomerative hierarchical clustering analysis, which reveals two highly stable autoimmune response clusters (bootstrap support for the main nodes ≥95%), a combination of islet AAbs and IFN-γ responses to all antigens tested (right cluster) as distinct from IL-10 responses to all antigens tested (left cluster). B: Dendrogram showing agglomerative hierarchical clustering analysis in which patients with type 1 diabetes form two distinct clusters (bootstrap support for the main nodes ≥97%) of approximately equal size. C: Combined analysis of the patient and autoimmune response clusters using unbiased hierarchical clustering in a heat map illustrating that the major discriminating factor between the two patient agglomerations is the presence of an IL-10 response (cluster-1, bottom left). Yellow indicates a positive response to an analyte and blue a negative response. CD4 T-cell peptide-specific responses are summarized into proteins (IA-2, GAD, proinsulin, and insulin). D: Plots showing the two principal components (PCs) of autoreactive T-cell responses in patients with type 1 diabetes, each identified as circles. The color of the symbol indicates AAb positivity (open = no AAb; yellow = 1 AAb+; orange = 2 AAb+; red = 3 AAb+). Numbered arrows represent vectors indicating the influence of individual analyte responses on PC1 and PC2. The length of the arrow reflects the strength of the effect. Solid lines are IFN-γ responses and broken lines IL-10 responses. Numbers 1–12 are the peptide identifiers (Table 1). The ovals outline putative patient clusters, with cluster A predominantly reflecting IFN-γ and cluster B IL-10 responses. IFG, interferon-γ; Ins, insulin; PI, proinsulin.
Cluster analysis of autoreactive T-cell and AAb responses in the blood close to diagnosis of type 1 diabetes. Blood samples from 33 children with newly diagnosed type 1 diabetes were analyzed for the quality (IFN-γ, IL-10, and AAbs) and specificity (proinsulin, insulin, IA-2, GAD65, and ZnT8) of autoimmune responses, generating results for 27 analytes summed to show responsiveness to the parent antigens. A: Dendrogram showing agglomerative hierarchical clustering analysis, which reveals two highly stable autoimmune response clusters (bootstrap support for the main nodes ≥95%), a combination of islet AAbs and IFN-γ responses to all antigens tested (right cluster) as distinct from IL-10 responses to all antigens tested (left cluster). B: Dendrogram showing agglomerative hierarchical clustering analysis in which patients with type 1 diabetes form two distinct clusters (bootstrap support for the main nodes ≥97%) of approximately equal size. C: Combined analysis of the patient and autoimmune response clusters using unbiased hierarchical clustering in a heat map illustrating that the major discriminating factor between the two patient agglomerations is the presence of an IL-10 response (cluster-1, bottom left). Yellow indicates a positive response to an analyte and blue a negative response. CD4 T-cell peptide-specific responses are summarized into proteins (IA-2, GAD, proinsulin, and insulin). D: Plots showing the two principal components (PCs) of autoreactive T-cell responses in patients with type 1 diabetes, each identified as circles. The color of the symbol indicates AAb positivity (open = no AAb; yellow = 1 AAb+; orange = 2 AAb+; red = 3 AAb+). Numbered arrows represent vectors indicating the influence of individual analyte responses on PC1 and PC2. The length of the arrow reflects the strength of the effect. Solid lines are IFN-γ responses and broken lines IL-10 responses. Numbers 1–12 are the peptide identifiers (Table 1). The ovals outline putative patient clusters, with cluster A predominantly reflecting IFN-γ and cluster B IL-10 responses. IFG, interferon-γ; Ins, insulin; PI, proinsulin.
Combined analysis of the patient and autoimmune response clusters using unbiased hierarchical clustering in a heat map illustrates that the major discriminating factor between the two patient agglomerations is the presence of an IL-10 response (Fig. 1C, cluster-1, bottom left). We applied additional analytical methods to support this conclusion. Cluster-1 patients have a significantly higher frequency of IL-10 response to GAD, insulin, proinsulin (all P < 0.0001), and IA-2 (P < 0.02) than cluster-2 patients. Of note, there are also differences in the frequency of islet AAbs between clusters. AAbs against IA-2 (P < 0.002) and ZnT8 (P < 0.05) are significantly less frequent in the IL-10–dominated cluster-1. Moreover, within cluster-1, two children had no islet AAbs present at diagnosis, five had only a single AAb, and eight had two or more AAbs. The frequency of multiple AAbs was significantly higher in cluster-2, in which all 18 children had two or more (P = 0.0015).
We did not observe significant biases in the distribution of the main diabetes-associated HLA alleles in the two agglomerations: Both DRB1*0401/X and DRB1*0301/X genotypes were present in 6 of the 15 subjects, respectively, in cluster-1 (40%), with the remaining 3 being heterozygous for DRB1*0401/*0301, and DRB1*0401/X was present in 11 of the 18 subjects (61%) and DRB1*0301/X in 3 (17%) in cluster-2, with the remaining 4 (22%) being heterozygous. In contrast to the stable clustering we observed for aggregated analytes (Fig. 1A and B), when single analytes are used, the main clusters are less stable (bootstrap scores for the two main nodes 81% and 85%; data not shown), supporting an approach in which epitope-specific responses are aggregated. PCA was used to assist in subdividing subjects or enabling assay refinement by exclusion of redundant analytes. As shown in Fig. 1D, although clustering patterns were largely reproduced, we did not find single prevalent sources of variation through this approach.
To summarize, these data show that combining AAb and the quality of CD4 T-cell responses to specific islet autoantigens partitions children with newly diagnosed type 1 diabetes into two distinct autoimmune response phenotypes characterized by islet AAbs plus IFN-γ or a pauci-AAb, IL-10–dominated response. These data reveal a hitherto unidentified association between IL-10 responses and regulated B-lymphocyte responses in vivo.
Autoimmune Inflammatory Phenotypes in Nondiabetic Siblings of Children With Type 1 Diabetes
We next explored the disease relationship of the autoimmune response phenotypes we had defined by studying nondiabetic siblings of type 1 diabetic patients. As expected, in siblings of children with newly diagnosed type 1 diabetes, islet AAbs, especially IA-2Ab and ZnT8Ab, were strongly associated with disease (Fig. 2). However, IFN-γ CD4 T-cell responses to derivative peptides of specific antigens, notably insulin and proinsulin, were also strongly and significantly associated with diabetes (Fig. 2A and B). Indeed, when T-cell responses were combined into a single analyte (i.e., the presence of an IFN-γ CD4 T-cell response to any autoantigen), disease association was comparable to detecting any islet AAb in terms of its ability to discriminate disease and health with equal sensitivity and specificity (Fig. 2C).

Autoimmune inflammatory phenotypes in nondiabetic siblings of children with type 1 diabetes. Graphs compare frequency of response to islet autoantigens in siblings of type 1 diabetic patients collected in a cross-sectional study (y-axis) with that in type 1 diabetic patients matched for age and studied close to diagnosis (x-axis). Blue circles denote IL-10 responses, red IFN-γ responses, and green AAb responses. Filled circles indicate a statistically significant difference (P < 0.05) in the frequency of responses between the two groups. Gray lines are 95% CIs. Numbered symbols in A indicate individual autoantigen peptides (Table 1). A: Comparison of response frequency against single analytes. Islet AAbs, and especially IA-2Ab and ZnT8Ab, are strongly diabetes-associated measurements. B: Single T-cell analytes were summed to indicate a response to a single autoantigen. IFN-γ CD4 T-cell responses to specific antigens, notably insulin and proinsulin, are strong and significant. C: T-cell analytes were summed to show a positive response to any autoantigen, and AAb responses were summed to show positivity to any autoantigen; disease discrimination is comparable between AAbs and T-cell responses. Ins, insulin; PI, proinsulin.
Autoimmune inflammatory phenotypes in nondiabetic siblings of children with type 1 diabetes. Graphs compare frequency of response to islet autoantigens in siblings of type 1 diabetic patients collected in a cross-sectional study (y-axis) with that in type 1 diabetic patients matched for age and studied close to diagnosis (x-axis). Blue circles denote IL-10 responses, red IFN-γ responses, and green AAb responses. Filled circles indicate a statistically significant difference (P < 0.05) in the frequency of responses between the two groups. Gray lines are 95% CIs. Numbered symbols in A indicate individual autoantigen peptides (Table 1). A: Comparison of response frequency against single analytes. Islet AAbs, and especially IA-2Ab and ZnT8Ab, are strongly diabetes-associated measurements. B: Single T-cell analytes were summed to indicate a response to a single autoantigen. IFN-γ CD4 T-cell responses to specific antigens, notably insulin and proinsulin, are strong and significant. C: T-cell analytes were summed to show a positive response to any autoantigen, and AAb responses were summed to show positivity to any autoantigen; disease discrimination is comparable between AAbs and T-cell responses. Ins, insulin; PI, proinsulin.
In contrast, IL-10 CD4 T-cell responses show a similar prevalence in siblings and children with diabetes (Fig. 2). However, when the clustering of aggregated analytes from the type 1 diabetes samples (Fig. 1) is superimposed on the nondiabetic sibling population, a large group of healthy islet AAb–negative children (low risk for type 1 diabetes) have IL-10 responses but no IFN-γ responses to islet antigens (Fig. 3A, top left cluster). Unsupervised analysis of aggregated analytes in nondiabetic siblings shows similar clustering (bootstrap scores for main clusters >93%; data not shown).
Clustering analysis of autoimmune inflammatory phenotypes in siblings. Unbiased hierarchical clustering analysis of autoimmune CD4 T-cell and AAb responses are represented as heat maps. A: Analysis of unaffected siblings in an unbiased, cross-sectional study. B: Analysis of high-risk, unaffected siblings with multiple (two or more) islet AAb positivity showing two main clusters characterized by the presence of IL-10 with sparse IFN-γ (lower left) and the presence of IFN-γ with sparse IL-10 (upper right). Yellow indicates a positive response to an analyte and blue a negative response. CD4 T-cell peptide-specific responses are summarized into proteins (IA-2, GAD, PI, and Ins). C: Plots showing two principal components (PCs) for siblings with two or more islet AAbs and at high risk of progression to disease; each subject is identified by a diamond, the color of which indicates AAb positivity (open = no AAb; yellow = 1 AAb+; orange = 2 AAb+; red = 3 AAb+; brown = 4 AAb+). For explanation of arrows, see Fig. 1D legend. The same oval outlines as in Fig. 1D are overlaid, and the corresponding clusters A (IFN-γ dominated) and B (IL-10 dominated) are identifiable in high-risk subjects. The subjects identified by arrows a and bin cluster A developed type 1 diabetes (ages 6 and 10 years, respectively, at diagnosis); the subject identified by arrow c in cluster B developed type 1 diabetes at age 18 years. IFG, interferon-γ; Ins, insulin; PI, proinsulin.
Clustering analysis of autoimmune inflammatory phenotypes in siblings. Unbiased hierarchical clustering analysis of autoimmune CD4 T-cell and AAb responses are represented as heat maps. A: Analysis of unaffected siblings in an unbiased, cross-sectional study. B: Analysis of high-risk, unaffected siblings with multiple (two or more) islet AAb positivity showing two main clusters characterized by the presence of IL-10 with sparse IFN-γ (lower left) and the presence of IFN-γ with sparse IL-10 (upper right). Yellow indicates a positive response to an analyte and blue a negative response. CD4 T-cell peptide-specific responses are summarized into proteins (IA-2, GAD, PI, and Ins). C: Plots showing two principal components (PCs) for siblings with two or more islet AAbs and at high risk of progression to disease; each subject is identified by a diamond, the color of which indicates AAb positivity (open = no AAb; yellow = 1 AAb+; orange = 2 AAb+; red = 3 AAb+; brown = 4 AAb+). For explanation of arrows, see Fig. 1D legend. The same oval outlines as in Fig. 1D are overlaid, and the corresponding clusters A (IFN-γ dominated) and B (IL-10 dominated) are identifiable in high-risk subjects. The subjects identified by arrows a and bin cluster A developed type 1 diabetes (ages 6 and 10 years, respectively, at diagnosis); the subject identified by arrow c in cluster B developed type 1 diabetes at age 18 years. IFG, interferon-γ; Ins, insulin; PI, proinsulin.
Autoimmune Inflammatory Phenotypes in Multiple Autoantibody–Positive Nondiabetic Siblings of Children With Type 1 Diabetes
To examine the relevance of autoimmune inflammatory phenotypes to the natural history of progression to type 1 diabetes, we identified a group of subjects with multiple (two or more) islet AAb positivity, a status known to confer a high risk of progression to disease. In these subjects (n = 14), analysis using the clustering model superimposed from the type 1 diabetes samples (Fig. 1) shows a pattern of responses comparable to those seen in type 1 diabetes. Nondiabetic subjects with ≥2 islet AAbs partitioned into two main clusters were characterized by 1) the presence of IL-10 with sparse IFN-γ and 2) the presence of IFN-γ with sparse IL-10 (Fig. 3B). Unsupervised analysis did not generate robust evidence of clustering, presumably reflecting the small number of high-risk subjects studied. We also examined whether PCA could potentially identify outcomes in the same high-risk subjects with multiple (two or more) islet AAbs. When this analysis was superimposed on patients with type 1 diabetes, we identified two potential clusters by arbitrary means (labeled A and B in Fig. 1D). These are dominated by IFN-γ and IL-10, respectively, tending to reinforce the findings from the cluster analysis. Applying the same analysis in high-risk siblings (Fig. 3C) indicates subjects within the same potential clusters. Since the studies were initiated, three of the high-risk subjects developed diabetes. The subject in the IL-10–dominated cluster was aged 18 years at diagnosis, whereas those in the IFN-γ cluster were aged 6 and 10 years.
Heterogeneity of Islet Infiltration in Recently Diagnosed Type 1 Diabetes
We considered the possibility that findings in the blood might have correlates in the pancreata of patients with type 1 diabetes (not available from the same cohort) and therefore examined insulitic profiles in a historical tissue collection from children (n = 21) who died close to diagnosis of diabetes (14). This revealed considerable variation in the absolute numbers of immune cells per islet identified by staining for CD45, CD20, CD4, CD8, and CD68 (Table 2). We noted a particularly high coefficient of variation for CD20 staining as an indication of dispersion of the frequency distribution; CD20 is a marker of late pro-B lymphocytes and memory B cells and plays a role in the development of plasma cells. In a recent report standardizing the definition of insulitis, it was noted that B-cell infiltrates are a major but later feature of insulitis (10) (Table 2). This was consistent with the current subjective analysis by microscopy in which we observed two distinct patterns of infiltration: one characterized by relatively large numbers of infiltrating immune cells, but especially CD20+, and the other by a relative paucity of immune cells with very low numbers being CD20+. Of note, similar patterns were seen in an additional two samples obtained through the JDRF nPOD collection, ascertained within 12 months of diagnosis (Fig. 4A–F).
Immunohistological findings in post mortem analysis of pancreas from 21 type 1 diabetic patients
| Immune cell markers | ||||
|---|---|---|---|---|
| CD8 | CD68 | CD20 | CD4 | |
| Mean (cells stained per islet) | 11.2 | 7.0 | 5.5 | 3.7 |
| SD | 9.4 | 6.1 | 8.0 | 3.1 |
| Lower 95% CI of mean | 6.9 | 4.2 | 1.8 | 2.3 |
| Upper 95% CI of mean | 15.4 | 9.7 | 9.1 | 5.1 |
| Number of subjects | 21 | 21 | 21 | 21 |
| Coefficient of variation (%) | 83.9 | 87.1 | 147.0 | 83.9 |

Immunohistological analysis of pancreas from patients with type 1 diabetes reveals heterogeneity of insulitis. Staining shows CD20+ cells in three representative islets from a single patient with abundant positivity (nPOD 6052) (A–C) and a single patient with absence of positivity (nPOD 6070) (D–F). Staining patterns correspond to hyper-immune CD20Hi and pauci-immune CD20Lo, respectively. CD20 staining was used to subdivide 21 patients into CD20Hi and CD20Lo categories by using mean CD20+ cell counts above and below 3.7 cells/islet.
Immunohistological analysis of pancreas from patients with type 1 diabetes reveals heterogeneity of insulitis. Staining shows CD20+ cells in three representative islets from a single patient with abundant positivity (nPOD 6052) (A–C) and a single patient with absence of positivity (nPOD 6070) (D–F). Staining patterns correspond to hyper-immune CD20Hi and pauci-immune CD20Lo, respectively. CD20 staining was used to subdivide 21 patients into CD20Hi and CD20Lo categories by using mean CD20+ cell counts above and below 3.7 cells/islet.
To simplify the analysis, we ranked the 21 subjects in the current study by CD20 staining and identified an inflection, the midpoint of which (mean 3.7 CD20+ cells per islet section) (Supplementary Fig. 1) was used to define CD20Hi and CD20Lo staining patterns. This divided the cohort into two approximately equal-sized groups (n = 9 and 12, respectively). These two groups differed significantly in the number of total (CD45+) immune cells (mean [SEM] 29.9 [4.3] vs. 13.2 [0.8] cells per islet section for the CD20Hi and CD20Lo groups, respectively, P < 0.01) and in cell numbers of the constituent subsets, such as CD20, CD8 (P < 0.01 for both) (Fig. 4G and H), and CD4 (P = 0.03), leading us to term these “hyper-immune CD20Hi” and “pauci-immune CD20Lo” patterns. CD68+ cells were not significantly different between the groups (P > 0.05). Differences between the two groups could not be ascribed to differences in the β-cell status of the islets studied because we examined the immune cell infiltration only in those islets with residual immune staining for insulin (i.e., islets with remaining β-cells). These data indicate that patterns of infiltration may represent functionally important pathological phenotypes, a hypothesis borne out by two further observations. First, we found that hyper-immune CD20Hi subjects had significantly fewer insulin-containing islets as a proportion of all islets identified than pauci-immune CD20Lo subjects (mean [SEM] 15.5 [4.8]% vs. 38.3 [6.9]%, P = 0.02). Second, we noted that the mean age of subjects with hyper-immune CD20Hi infiltration was significantly lower than that of pauci-immune CD20Lo subjects among this cohort (mean [SEM] 7.8 [1.7] vs. 13.0 [1.5] years, P = 0.03). Taken together, these data suggest that children and adolescents studied close to diagnosis of type 1 diabetes may be distinguished on tissue pathology by two age-related and residual insulin–related patterns characterized by high and low degrees of cellularity and B-lymphocyte infiltration.
Discussion
In the current study, we use two complementary analyses of tissue and blood to identify disease-related subphenotypes in type 1 diabetes. This blood-based study shows that approximately one-half of patients analyzed close to diagnosis have T-cell responses characterized by IFN-γ, whereas one-half are distinguished as having IL-10 responses along with significantly fewer autoantibodies. In pancreas tissue obtained close to disease diagnosis, approximately one-half of the patients studied showed an inflammatory islet infiltration distinguished by high numbers of CD20+ B lymphocytes, whereas one-half of the patients had sparse infiltration and significantly fewer B lymphocytes. We speculate that these blood and tissue phenotypes are related, providing a potential pathophysiological basis for disease heterogeneity of relevance to stratification for therapeutic trials.
β-cell–specific autoreactivity in the blood is the hallmark of type 1 diabetes (2). The current study is the first to our knowledge to simultaneously assess multiple parameters of autoimmunity that span CD4 T-cell and B-lymphocyte responses by using integrated, multidimensional cluster analysis. We show in children/adolescents with type 1 diabetes that one or another autoimmune response phenotype, definable as [AAb++ and IFN-γ >> IL-10] and [AAb± and IFN-γ << IL-10] is likely dominant at the late stage of disease. In addition, we show the same autoimmune response phenotypes in nondiabetic individuals with multiple (two or more) AAbs and a high risk of progression to type 1 diabetes. Successive studies will require longitudinal follow-up of the high-risk group to establish whether the autoimmune response phenotypes are stable over time and indicate a fixed pathway of disease progression, which would be important for deployment of such analyses as stratification tools in prevention studies. Further development and refinement of the multiparameter model could be achieved through inclusion of additional measurements of autoreactivity, such as circulating CD8 T cells specific for β-cell epitopes (3,16). This approach may prove of clinical value but will require greater numbers to be studied and a longer period of follow-up.
In addition to these studies in the blood, we returned to a collection of samples obtained post mortem close to diagnosis of type 1 diabetes on which we have previously published findings on the immune cell infiltrate (10,14,17,18). Using a new consensus classification of insulitis (10) and focusing on defining patient-specific immune cell infiltration, we made the novel observation that patients can be categorized according to hyper-immune CD20Hi and pauci-immune CD20Lo insulitis phenotypes. When considered in the light of the current observations in the blood, an obvious conclusion is that hyperimmune CD20Hi subjects have the [AAb++ and IFN-γ >> IL-10] autoimmune response phenotype, whereas pauci-immune CD20Lo subjects demonstrate [AAb± and IFN-γ << IL-10] reactivity. This speculation derives some support from the fact that both subphenotypes (immunohistological and blood derived) divided the subjects into two roughly equal-sized groups. In addition, clear mechanistic links can be drawn between having pauci-AAb status in the blood [presumably as a result of antigen-specific immune regulation by islet-specific IL-10–positive CD4 T cells (19)] and low or absent levels of B-lymphocyte infiltration in the islets. Future studies will be required to focus on the mechanisms of this effect and whether it involves additional cell types, such as the recently described T-follicular-helper and T-follicular-regulatory cells (20,21). The linking of these blood and islet findings represents a vital conjecture, which will require additional studies of both T cells and histology from the same patient, for example, through the JDRF nPOD collection. This inability to link blood and islet phenotypes in the same individual represents an important limitation of the current study, as does the relatively brief follow-up and lack of prospective studies, but these issues can be addressed in future cohorts.
The observations in relation to age and type of autoimmune response in this and our previous study (6) raise the question about the underlying basis for the different subphenotypes we observed. It could be that disease endotypes exist that reflect different immunological pathways to disease, as has been proposed in asthma (22,23). An alternative possibility is that the underlying effector pathways are not intrinsically different but that the degree and rate of immune regulation is a dominant discriminative feature. In this scheme, the pauci-immune CD20Lo and [AAb± and IFN-γ << IL-10] immune phenotypes could be considered to indicate partially regulated effector responses, which may more likely be present in older subjects (24). We have previously shown that IL-10–secreting β-cell–specific CD4 T cells have potent regulatory properties (19) and are present in healthy subjects and relatively enriched in older adults with type 1 diabetes (19). In the current study, we reinforce this concept by reproducing a previous finding that IL-10–mediated autoreactivity is frequently detected in siblings of type 1 diabetic patients who are AAb negative and have very low disease risk (25). We also extend the concept by showing evidence of operational autoreactive B-lymphocyte nonresponsiveness (tolerance) in vivo when IL-10 responses are present. Taken together, these observations emphasize the importance of autoreactive CD4 T cells that secrete IL-10 in influencing disease pathogenesis. Recent results from our groups indicate that IL-10 production from both B cells and islet antigen–specific CD4 T cells is under genetic control, with evidence for a specific association of the IL2-IL21 region on chromosome 4q27 (26).
Most relevant to current translational objectives in type 1 diabetes perhaps are the potential implications of this study for therapeutic strategies. The question of whether type 1 diabetes is a heterogeneous disease has taken on considerable importance in recent years as successful immune-based therapies begin to be tested in phase II and III clinical trials (27–31). Heterogeneity, or the existence of endotypes defined by discrete pathophysiological mechanisms with the potential to explain distinct clinical features and response to treatment, could open up the prospect of stratification and personalized medicine, both of which are emerging aspirations for the management of complex autoimmune and inflammatory diseases in modern health-care systems (32). As one obvious example of the translatability of the current findings, it is likely that B-lymphocyte depletion using rituximab would have a different therapeutic impact, depending on whether CD20+ cells are a dominant feature of insulitis and actively engaged in the inflammatory process, as indicated by biomarkers such as multiple circulating AAbs and IFN-γ production, or not, as evidenced by few or no AAbs and high IL-10 responses. Indeed, the original report of rituximab therapy in type 1 diabetes showed trends for greater treatment efficacy (preservation of stimulated C-peptide levels) in younger versus older patients and in those with two or more AAbs as opposed to a single specificity (31). Thus, it seems probable that future studies of this and other therapeutics for the prevention of β-cell destruction are likely to benefit from a greater emphasis on prospective and post hoc analyses that make use of multiparameter measurements of T- and B-lymphocyte autoreactivity, such as those defined in the current study.
See accompanying article, p. .
Article Information
Acknowledgments. The authors thank Linda Wicker, Ricardo Ferreira, and Chris Wallace for useful comments on the manuscript. The authors also thank the study volunteers and the staff at participating D-GAP (Diabetes, Genes, Autoimmunity and Prevention study) hospital sites, including the Wellcome Trust Clinical Research Facility, Addenbrooke’s Clinical Research Centre, Cambridge, for help in conducting the study. In addition, they thank the following trusts for assistance in participant recruitment: Oxford University Hospitals; West Suffolk Hospital; Ipswich Hospital; Northampton General Hospital; West Hertfordshire Hospitals; Hinchingbrooke Health Care NHS Trust; James Paget University Hospitals; Queen Elizabeth Hospital King’s Lynn; Peterborough City Hospital; Royal Alexandra Children’s Hospital, Brighton; Colchester Hospital; Basildon and Thurrock University Hospitals; Broomfield Hospital, Chelmsford; Southend University Hospital; Barking, Havering and Redbridge University Hospitals; Queen Alexandra Hospital, Portsmouth; Southampton General Hospital; University Hospital of North Staffordshire; Royal Berkshire Hospital; North and East Herts NHS Trust; and Luton and Dunstable Hospital NHS Foundation Trust. Finally, the authors thank NIHR Clinical Research Network for support.
Funding. The study was supported by a Center grant from the JDRF (1-2007-1803 to P.J.B., J.A.T., C.G., D.B.D., and M.P.) and by the National Institute for Health Research (NIHR) Biomedical Research Centre based at Guy’s and St Thomas’ NHS Foundation Trust and King’s College London. N.G.M. and M.P. are funded through a European Union (EU FP7) award, Persistent Virus Infection in Diabetes Network Study Group (PEVNET, 261441). M.P. receives funding through the EU FP7 Large-Scale Focused Collaborative Research Project on Natural Immunomodulators as Novel Immunotherapies for Type 1 Diabetes (NAIMIT, 241447) and β-cell preservation through antigen-specific immunotherapy in Type 1 Diabetes: Enhanced Epidermal Antigen Delivery Systems (EE-ASI, 305305). Additional recruitment of AAb+ nondiabetic subjects was achieved with approval from the Ancillary Studies Committee of Type 1 Diabetes TrialNet Study Group. The Type 1 Diabetes TrialNet Study Group is a clinical trials network funded by the National Institutes of Health (NIH) through the National Institute of Diabetes and Digestive and Kidney Diseases, the National Institute of Allergy and Infectious Diseases, and the Eunice Kennedy Shriver National Institute of Child Health and Human Development through cooperative agreements U01-DK-061010, U01-DK-061016, U01-DK-061034, U01-DK-061036, U01-DK-061040, U01-DK-061041, U01-DK-061042, U01-DK-061055, U01-DK-061058, U01-DK-084565, U01-DK-085453, U01-DK-085461, U01-DK-085463, U01-DK-085466, U01-DK-085499, U01-DK-085505, and U01-DK-085509 and contract HHSN267200800019C; the National Center for Research Resources through Clinical Translational Science Awards UL1-RR-024131, UL1-RR-024139, UL1-RR-024153, UL1-RR-024975, UL1-RR-024982, UL1-RR-025744, UL1-RR-025761, UL1-RR-025780, UL1-RR-029890, and UL1-RR-031986 and General Clinical Research Center Award M01-RR-00400; the JDRF; and the American Diabetes Association (ADA). The contents of this article are solely the responsibility of the authors and do not necessarily represent the official views of the NIH, JDRF, or ADA. The views expressed are those of the authors and not necessarily those of the NHS, NIHR, Department of Health, NIH, JDRF, or ADA.
Duality of Interest. No potential conflicts of interest relevant to this article were reported.
Author Contributions. S.A. contributed to the study concept and design, research supervision, experiments, data analysis, and writing of the manuscript. P.L., V.N., K.M., N.M.N., M.E., A.W., and S.J.R. contributed to the experiments. D.K.-V., E.d.R., and A.L. contributed to the statistical analyses. P.J.B., C.G., D.B.D., and J.P. contributed to recruiting and characterizing patients. J.A.T., A.K.F., N.G.M., and M.P. contributed to the study concept and research supervision. M.P. is the guarantor of this work and, as such, had full access to all of the data in the study and takes responsibility for the integrity of the data and the accuracy of the data analysis.