
In this May edition of the RealtyHop Housing Affordability Index, we examine what American households across the 100 largest cities need to spend on housing to find out:
Is homeownership affordable or possible for the average American family?
Mortgage rates remain above 6.5%, and housing costs have increased for prospective buyers this month. Despite more inventory, most buyers still face unaffordable costs, which price them out of their respective markets. With the median list price climbing in 86 of the 100 cities, those looking to buy must further evaluate their budgets and wish lists.
Key Findings
- Homebuyers in 88 out of the 100 major cities we analyzed would have to spend over 30% of their annual income on homeownership; that’s seven more than last month.
- In the 25 most unaffordable housing markets nationwide, homeowners spend at least 49% of their income on homeownership costs.
- California remains unaffordable for average Americans. Three of the five least affordable cities are in the state.
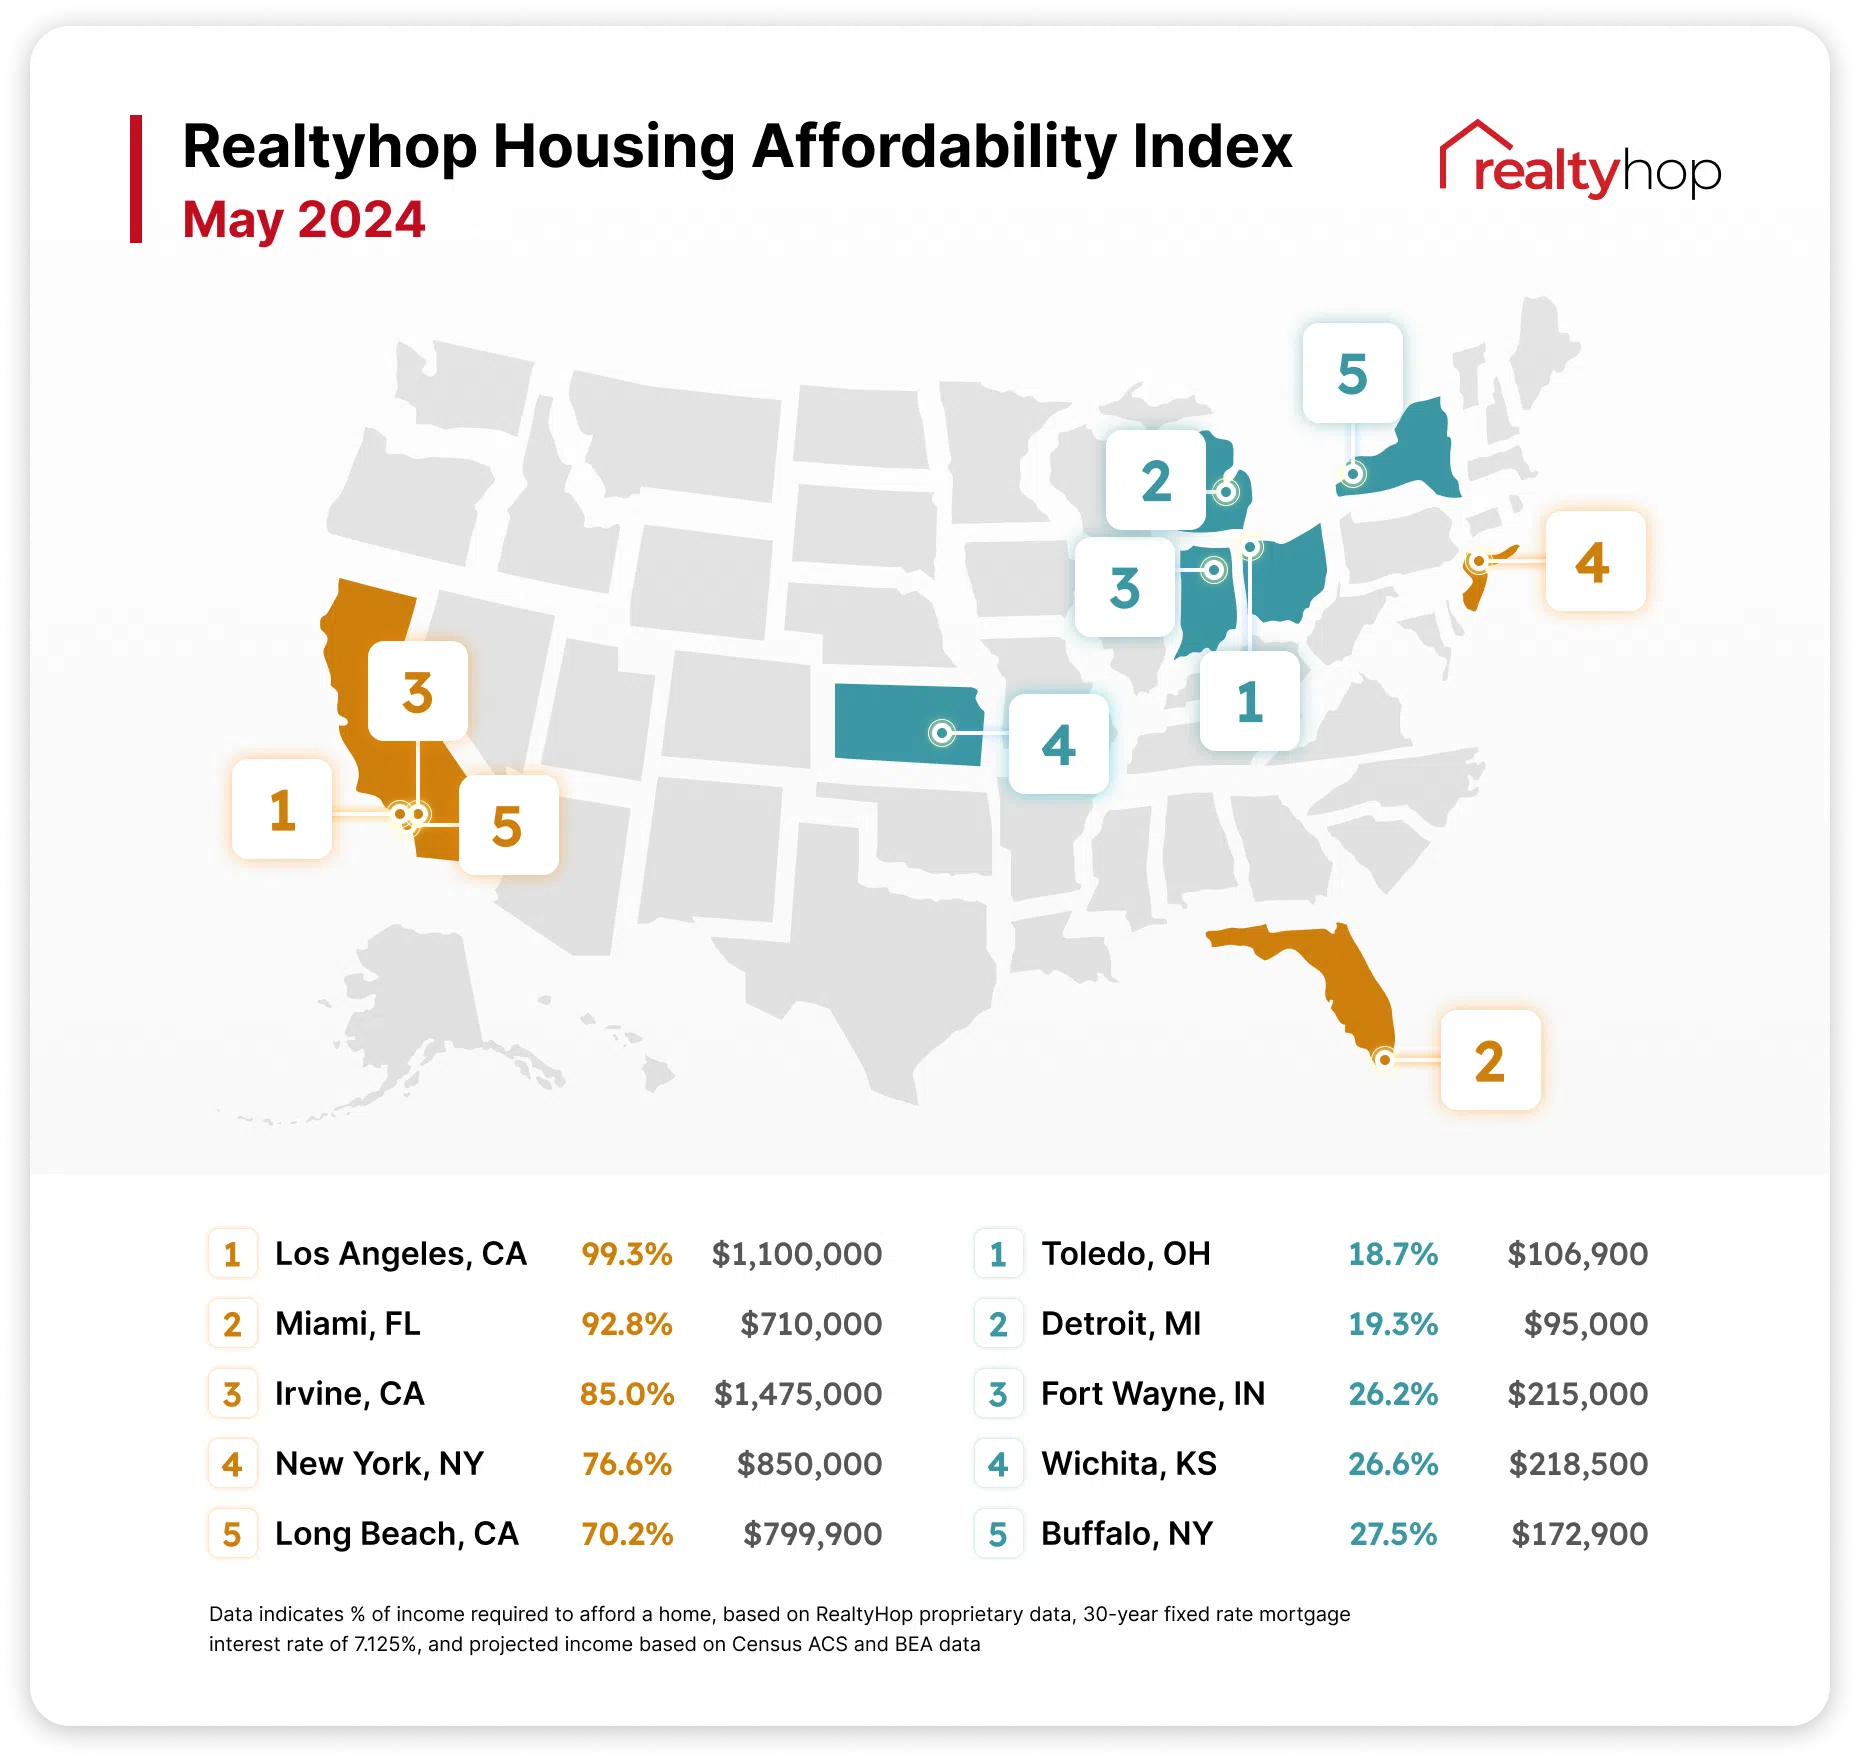
- Four of the top five least affordable housing markets became more expensive this month – Los Angeles, CA, Irvine, CA, New York City, NY, and Long Beach, CA.
- Housing costs became less affordable in all five of the more affordable housing markets this month – Toledo, OH, Detroit, MI, Fort Wayne, IN, Wichita, KS, and Buffalo, NY.
The 5 Least Affordable Housing Markets
1. Los Angeles, CA
Los Angeles remains the country’s least affordable housing market. The median list price increased to $1,100,000, meaning average families making the median income in the city must now expect to spend a whopping 99.33% of their income on homeownership costs.
2. Miami, FL
Miami maintained its spot as the second least affordable housing market. The once most unaffordable city in the country has been showing signs of cooling. The median list price for a home decreased to $710,000, and the average family will spend $4,378.55 monthly on mortgage payments and property taxes.
3. Irvine, CA
Irvine also held its spot in the rankings as the third least affordable market. The median list price for a home in this city increased to $1,475,000, and homeowners can now expect to spend 84.96% of their monthly income on housing costs.
4. New York, NY
New York City is the fourth most cost-burdened housing market. A family with an average income can expect to spend 76.63% of it on a home with a median list price of $850,000.
5. Long Beach, CA
Long Beach rounds out our list of the least affordable housing markets. Prospective buyers with a median income of $81,509 can expect to spend $4,770.59 on mortgage payments and property taxes.
The 5 Most Affordable Housing Markets
1. Toledo, OH
Toledo jumped one spot in the rankings to become the most affordable housing market nationwide this month. An average family can expect to spend 18.66% of their monthly income on mortgage and tax payments.
2. Detroit, MI
Detroit dropped down to the country’s second-most affordable housing market. With a median list price of $95,000, buyers can expect to direct 19.29% of their income toward homeownership costs.
3. Fort Wayne, IN
Fort Wayne remains the third most affordable housing market. The median list price increased to $215,000 this month, and buyers can expect to spend 26.22% of their income on housing costs.
4. Wichita, KS
Wichita ranked as the fourth most affordable housing market. Homeowners with an average income of $62,644 will spend $1,389.72 monthly on mortgage and tax payments.
5. Buffalo, NY
Buffalo is the country’s fifth most affordable housing market this month. Households can expect to spend 27.46% of their monthly income on a home with a median list price of $172,900.
Housing Markets to Watch
The following housing markets witnessed significant changes this month.
Richmond, VA
Richmond jumped ten spots in the rankings and became the 43rd least affordable housing market. The median home price has increased by 7.93% since last month, now reaching $375,000. Homeowners can expect to spend 44.85% of their monthly income on housing costs. New renovations and buildings entice out-of-town buyers to purchase in the area, increasing the value of housing in the area.
Anchorage, AK
Anchorage became more affordable for homeowners this month, decreasing to the 86th spot in our rankings. Prospective homebuyers can now expect to spend 29.37% of their income toward a home with a median list price of $380,000.
Chicago, IL
Chicago dropped eight spots in the rankings and became the 70th least affordable housing market this month. The median list price increased by 7.47%, and homebuyers with a median income can expect to direct 38.50% of it toward mortgage payments and property taxes.
Methodology
The RealtyHop Housing Affordability Index analyzes proprietary and ACS Census data to provide an index of housing affordability and homeownership burden across the 100 most populous cities in the country. Median home prices are calculated using over 800,000 listings in the RealtyHop database over the month prior to publication.
To calculate the index, the following statistics are used:
1) Projected median household income
2) Median for-sale home listing prices via RealtyHop data
3) Local property taxes via ACS Census data
4) Mortgage expenses, assuming a 30-year mortgage, 7.125% mortgage interest rate based on reported weekly averages in March, and 20% down payment.
March 2024 Methodology Update
Instead of assuming a fixed mortgage rate, starting with this month’s report, the RealtyHop Affordability Index calculates the monthly payments using the 30-Year Fixed Rate Mortgage Average reported by Freddie Mac. In the past, our calculation for median prices included all closed and active residential listings created within a month prior to the publication of each report. Moving forward in 2024, the median price is only calculated based on list prices. This change will better reflect the conditions prospective buyers face in a given market.