

Abstract
Introduction: Sleep disturbances are highly prevalent across most major psychiatric disorders. Alterations in the hypothalamic-pituitary-adrenal axis, neuroimmune mechanisms, and circadian rhythm disturbances partially explain this connection. The gut microbiome is also suspected to play a role in sleep regulation, and recent studies suggest that certain probiotics, prebiotics, synbiotics, and fecal microbiome transplantation can improve sleep quality. Methods: We aimed to assess the relationship between gut-microbiota composition, psychiatric disorders, and sleep quality in this cross-sectional, cross-disorder study. We recruited 103 participants, 63 patients with psychiatric disorders (major depressive disorder [n = 31], bipolar disorder [n = 13], psychotic disorder [n = 19]) along with 40 healthy controls. Sleep quality was assessed with the Pittsburgh Sleep Quality Index (PSQI). The fecal microbiome was analyzed using 16S rRNA sequencing, and groups were compared based on alpha and beta diversity metrics, as well as differentially abundant species and genera. Results: A transdiagnostic decrease in alpha diversity and differences in beta diversity indices were observed in psychiatric patients, compared to controls. Correlation analysis of diversity metrics and PSQI score showed no significance in the patient and control groups. However, three species, Ellagibacter isourolithinifaciens, Senegalimassilia faecalis, and uncultured Blautia sp., and two genera, Senegalimassilia and uncultured Muribaculaceae genus, were differentially abundant in psychiatric patients with good sleep quality (PSQI >8), compared to poor-sleep quality patients (PSQI ≤8). Conclusion: In conclusion, this study raises important questions about the interconnection of the gut microbiome and sleep disturbances.
Introduction
A close link between sleep disturbances and psychiatric disorders is well recognized [1], and up to 40.8% of psychiatric patients experience symptoms of sleep disorders [2]. Major depressive disorder (MDD) is associated with sleep disturbances in 92% of patients [3, 4], and clinically significant sleep disturbances have been observed in 70% of euthymic patients with bipolar disorder (BD) [3, 5]. Insomnia can be a prodromal symptom in schizophrenia, leading to acute psychotic episodes and potentially worsening the psychotic symptoms [3, 6, 7]. Sleep disturbances in psychiatric disorders are associated with poorer quality of life, greater impairment of function, and a more malignant course of the disorder [8]. Adequate treatment of sleep disturbances in MDD leads to clinically significant improvements in quality of life [9, 10]. However, the underlying pathophysiological mechanisms through which psychiatric disorders and sleep interact are not yet fully elucidated. Several theories have been proposed, and it is likely that many different pathways are involved including the hypothalamic-pituitary-adrenal axis [11, 12], circadian rhythm disturbances [13, 14], and neuroimmune mechanisms [15]. In recent years, the microbiota-gut-brain axis (MGBA) has been suggested as a potential mechanistic link between psychiatric disorders and sleep [16, 17].
The MGBA is a bidirectional signaling system, connecting the gastrointestinal tract and the central nervous system. There are a variety of routes of communication involved in this dynamic gut-brain network. First, there is the direct production of neurotransmitters (such as gamma-aminobutyric acid, serotonin, and dopamine) by the gut microbiota, influencing endocrine cells, immune cells, metabolic pathways, and the vagus nerve, resulting in informational transmission to the central nervous system [18‒21]. Another speculated mechanism of communication involves short-chain fatty acids (SCFAs), which are the primary products of bacterial fermentation of dietary fiber in the gastrointestinal tract [22, 23]. SCFAs such as butyrate have far-reaching effects. They play a role in maintaining the permeability of the intestinal barrier, counteracting the effect of pro-inflammatory cytokines such as IL-6 and TNF-α which can disrupt intestinal barrier integrity. Additionally, SCFAs act as important epigenetic regulators by inhibiting histone deacetylases, thereby influencing colonic and systemic inflammation processes [24, 25]. As both psychiatric disorders and sleep disturbances are associated with inflammation, these interlinking pathways between the gut microbiome and inflammation are of major interest [26]. Furthermore, gut hormone and serotonin release are directly influenced by butyrate with subsequent effects on vagus nerve activation, in turn leading to modulation of brain function [18, 23, 27, 28]. An increasing body of evidence suggests that the gut microbiome plays an important role in not only digestive, immunological, and metabolic functions but also in regulating sleep, circadian rhythm, and mental states [29, 30]. Sleep deprivation in mice and rats provoked significant alterations in gut microbiome composition, which were reversible after a week of recovery sleep [31, 32]. After fecal microbiota transplantation in patients with irritable bowel syndrome, psychiatric symptoms and the sleep subscale score of the Hamilton Rating Scale for Depression (HAM-D) improved significantly [33]. Interestingly, cross-sectional studies analyzing sleep quality and gut microbiome composition in BD showed a negative correlation between sleep quality, Faecalibacterium, and Lactobacillus[34, 35]. A recent meta-analysis showed a transdiagnostic pattern of reduced butyrate-producing bacteria like Faecalibacterium and an elevation of pro-inflammatory bacteria like Eggerthella in patients with MDD, BD, schizophrenia, and generalized anxiety disorder [36]. Additionally, it has previously been observed that probiotic treatment with strains of Lactobacillus, as well as probiotic treatment with strains of Bifidobacterium positively influence self-rated sleep quality [37]. A meta-analysis suggests that probiotic interventions with strains of Lactobacillus and Bifidobacterium resulted in a significantly reduced Pittsburgh Sleep Quality Index (PSQI), which is an indicator of better sleep quality [38].
Although a growing body of evidence suggests that the gut microbiome plays a role in the complex pathophysiology of sleep disturbances, a systematic understanding of how the microbiome influences sleep in psychiatric disorders is still lacking. Therefore, we aimed to study the interconnection between sleep quality measured with the PSQI and the gut microbiome in a cross-sectional, cross-disorder design. First, we compared gut microbiome diversity indices of patients with psychiatric disorders to healthy controls (HC). Second, we assessed the association between gut microbiome diversity indices and sleep quality in the patient group and HC. Third, we explored differences in differential abundances between patients with good and poor sleep quality.
Materials and Methods
Study Participants
The “Multi-Omics Study of Chronobiology and Nutritional Psychiatry” (short title: “MOMIC Chrono-Nutri Psy”) was conducted as a cross-sectional, cross-disorder study, due to the commonly shared symptoms of disturbed sleep between psychiatric disorders, with the approval of the local Ethics Committee (EK 32-651 ex 19/20). We included 103 participants, 63 patients with psychiatric disorders (MDD [n = 31], BD [n = 13], psychotic disorders including schizophrenia and schizoaffective disorder [n = 19]) and a control group of 40 HC in our study. Participants were recruited during an inpatient stay at the Department for Psychiatry and Psychotherapeutic Medicine in Graz, Austria. All patients received the same hospital meals, the same therapeutic measures (ergotherapy and physiotherapeutic therapy) and received pharmacological standard care treatment. In the current investigated sample, we included study participants with MDD, BD, and psychotic disorder (schizophrenia and schizoaffective disorder) at the age of 18–75 years. Diagnoses were assessed by psychiatrists according to the Mini International Neuropsychiatric Interview (MINI) [39] and ICD-10. The HC group included study participants without any history of psychiatric disorders and without first- and second-degree relatives having a mental disorder. More specifically, the HC included healthcare staff, university students, and citizens from different professions recruited with flyers. All patients and HC provided written informed consent with legal capacity. Exclusion criteria for patients and HC alike were the following: (1) severe drug intoxication (with loss of reality), (2) current severe psychiatric disorder (acute severe mania or psychosis with loss of reality), (3) status post severe craniocerebral trauma or brain surgery, (4) tumor disease, (5) mental retardation, (6) dementia, and (7) severe autoimmune disease or current immunosuppression treatment.
Data Collection
During the last week of their inpatient stay, study participants received a detailed clinical interview conducted by either a trained psychiatrist or a psychologist to assess the psychiatric diagnosis according to ICD-10 [3], using the standardized diagnostic tool MINI [39]. To assess self-reported sleep quality, the PSQI was utilized to collect information about the duration of sleep, the onset of sleep, sleep efficiency, subjective sleep quality, disturbances of sleep, sedative-hypnotic drug use, and exercise habits during the past month to calculate a total score measuring sleep quality [40]. The patient group was divided into a good-sleep quality subgroup by a PSQI cutoff score of 8 or below and a poor-sleep quality subgroup determined by a PSQI cutoff score above 8 as it was suggested to be a more accurate distinction in clinical practice than the originally suggested cutoff score of >5 to distinguish between good sleepers and poor sleepers [41‒43]. Additionally, we documented demographic and clinical parameters including sex, age, height, weight, current medication regimen, alcohol consumption, smoking habits, allergies, and food intolerances as well as somatic comorbidities. Two tubes (1 g per tube) of stool samples per participant were collected within 3 days after interviewing and immediately stored at −20°C until 16S rRNA sequencing. During their inpatient stay, all patients experienced similar living conditions, such as daily routines, therapeutic interventions, and diet and exercise regime, upon entering the study and received treatment as usual psychopharmacological therapy.
Microbiome Analysis
DNA isolation for microbiome analysis was done on a QIASymphony (QIAGEN, Hilden, Germany) device using the QIAsymphony DSP Virus/Pathogen Mini Kit (QIAGEN, Hilden, Germany) with a protocol adapted to stool samples, described in detail in the online supplementary material (for all online suppl. material, see www.karger.com/doi/10.1159/000530386). For 16S rRNA gene PCR amplification, reactions were performed in triplicates, and each reaction contained 2 μL DNA, 1 × Fast Start High Fidelity Buffer (FastStart High Fidelity PCR System, dNTPack, Roche, Mannheim, Germany), 1.25 U High Fidelity Enzyme (FastStart High Fidelity PCR System, dNTPack, Roche, Mannheim, Germany), 200 µM dNTPs (FastStart High Fidelity PCR System, dNTPack, Roche, Mannheim, Germany), 0.4 µM forward and reverse primers and PCR-grade water (VWR, Vienna, Austria). The primer sequences were located in hypervariable region V4, modified according to Walters et al. [44] and supplemented with Illumina adaptors for indexing PCR reaction according to Illumina’s 16 s metagenomic sequencing library preparation guide (16s sample preparation: https://support.illumina.com/content/dam/illumina-support/documents/documentation/chemistry_documentation/16s/16s-metagenomic-library-prep-guide-15044223-b.pdf Guide (illumina.com); last accessed: March 2022), giving the following sequences:
MiSeqF-v4_515Fmod (TCGTCGGCAGCGTCAGATGTGTATAAGAGACAGGTGYCAGCMGCCGCGGTAA).
MiSeqR-v4_806Rmod (GTCTCGTGGGCTCGGAGATGTGTATAAGAGACAGGGACTACNVGGGTWTCTAAT).
For PCR amplification, the following conditions were used: 3 min initial denaturation at 95°C, 30 cycles of denaturation (45 s at 95°C), primer annealing (45 s at 55°C), and extension (72°C for 1 min). This protocol was complemented by a final extension step at 72°C for 7 min and subsequent cooling to 10°C. The triplicates were pooled and checked on a 1.5% agarose gel. Quality control and subsequent steps are described in detail in the online supplementary material.
At “Center for Medical Research” (ZMF) Core Facility Molecular Biology in Graz, Austria, 9:00 p.m. of the final library was sequenced using an Illumina MiSeq desktop (Illumina, Eindhoven, Netherlands) with v3 chemistry for 600 cycles along with 20% PhiX Control DNA (Illumina, Eindhoven, Netherlands) according to the manufacturer’s instructions. FASTQ files were used for subsequent data analysis.
Bioinformatics and Statistical Analysis
Unpaired FASTQ files were used as input for subsequent bioinformatic analysis. The raw sequencing data were processed using Quantitative Insights Into Microbial Ecology 2 (QIIME2) scripts on the galaxy server of the Medical University of Graz (galaxy.medunigraz.at) [45]. FASTQ files were paired, demultiplexed, dereplicated, and quality-checked. Preprocessing continued by utilizing the DADA2 inference algorithm [46] and chimera were removed. For taxonomic identification, sequences were aligned against the SILVA 132 release database using the Scikit-learn classifier. For de novo multiple sequence alignment, we made use of MAFFT, to then build a phylogenetic tree with FastTree [47, 48].
To calculate alpha diversity, a rarefied feature table with 9,000 reads per sample was used. To measure species evenness, which refers to the even distribution of species in numbers within a sample, the Pielou’s Evenness index [49] was used. Faith’s phylogenetic diversity (PD) [50] index was used to incorporate the phylogenetic difference between species. The number of observed species [51] was used to approximate richness. Diversity was estimated with the Shannon index [52]. Visualization of alpha diversity was done in R (4.2) and RStudio (2022.02.2) (R foundation, Vienna, Austria). Alpha diversity indices were compared between HC and psychiatric diagnosis groups with the pairwise Kruskal-Wallis test. For beta diversity metrics, analysis of similarities (ANOSIM) based on Bray-Curtis dissimilarity, Jaccard dissimilarity, and unweighted and weighted UniFrac distance matrices were used to identify similarities of microbiome structures between groups. Principal coordinate analysis was performed with Bray-Curtis dissimilarity and Jaccard dissimilarity to visualize beta diversity indices. The Firmicutes/Bacteroidetes (F/B) ratio was calculated based on the rarefied feature table mentioned above. To identify differentially abundant taxa between groups, Microbiome Multivariable Association with Linear Models 2 (MaAsLin2) was used.
Statistical analysis was done with the software SPSS (IBM Corp. Released 2017. IBM SPSS Statistics for Windows, Version 25.0. Armonk, NY: IBM Corp). To test for normal distribution, the Kolmogorov-Smirnov test and the Shapiro-Wilk test were used, in conjunction with visual assessment of Q-Q plots and histograms. To control for potential confounding variables, we evaluated the correlation of the PSQI score and clinical parameters, as well as demographic data before further statistical testing of our major aims, which revealed no significant correlations in either group (see “Correlation Analysis of PSQI, Diversity Indices, and Clinical Parameters” in the Results section, online suppl. Table A.1, A.2). As PSQI did not correlate with our major markers, we did not correct for the clinical parameters in the major investigations. We compared clinical and demographic variables between groups using the χ2 test for categorical variables. To compare normally distributed continuous variables, the t test was utilized. For comparison of non-normal continuous variables, we used the Mann-Whitney U test. Nonparametric Spearman-rho-correlation analysis was used to investigate the relationship between non-normal distributed continuous variables and biserial rank correlation analysis to assess correlations between dichotomous and continuous variables.
Results
Evaluation for Confounding Variables regarding Sleep Quality
Before statistical testing our main hypothesis, the PSQI score, serving as the main variable measuring sleep quality in our sample, was evaluated for potential confounding factors in the patient and HC group, respectively, as described in the Methods section. As a consequence of no significant correlations between potential confounding clinical variables and the PSQI score, we abstained from further statistical correction. The detailed results for either group are described in “Correlation Analysis of PSQI, Diversity Indices, and Clinical Parameters” below and in online supplementary Table A.1 and A.2.
Cohort Description
Demographic and clinical data of the 63 patients and 40 HC are depicted in Table 1. Patients were slightly older, had a higher body mass index and smoked more than HC. There were no significant differences between sex or alcohol consumption observed. A significant difference was found comparing the total PSQI score between groups, with a mean score of 10 in the patient group and a mean score of 3.78 in the HC group.
Demographic and clinical parameters of patients and HC
| Parameters | Patients (n = 63) | HC (n = 40) | χ2/Z | p value |
|---|---|---|---|---|
| Diagnosis (MDD/BD/psychotic disorder) | 31/13/19 | / | ||
| Sex (female/male) | 36/27 | 27/13 | 1.11 | 0.293 |
| Alcohol consumption (yes/no) | 27/36 | 22/18 | 1.45 | 0.229 |
| Age, years | 43.03±13.93 | 36.88±11.32 | −2.18 | 0.03* |
| BMI, kg/m2 | 27.44±7.46 | 22.99±2.51 | −2.87 | 0.004* |
| Smoking, pack-years | 9.70±24.53 | 1.501±6.49 | −6.55 | <0.001*** |
| PSQI | 10±4.66 | 3.78±2.72 | −3.67 | <0.001*** |
Data are presented as numbers or mean ± standard deviation.
Differences were tested with χ2 tests (χ2) or Mann-Whitney U tests (Z). Statistical significance of p values is described as p < 0.05 (*) and p < 0.001 (***).
BMI, body mass index; HC, healthy controls; MDD, major depressive disorder; BD, bipolar disorder; PSQI, Pittsburgh Sleep Quality Index.
Alpha Diversity
The patients were divided into subgroups based on their psychiatric diagnosis and compared to HC separately. There were no significant differences observed in alpha diversity indices, comparing the BD and HC groups. In the MDD group, however, the Pielou’s Evenness index (H = 5.539, p = 0.019), Faith’s PD index (H = 4.307, p = 0.038), and Shannon index (H = 5.007, p = 0.025), all markers for alpha diversity, were found to be significantly reduced compared to HC. No difference was detected in observed species between the two groups (H = 3.209, p = 0.073). Patients with psychotic disorders showed significantly lower alpha diversity scores than HC in the Shannon index (H = 5.609, p = 0.018), observed species (H = 1.814, p = 0.178), Pielou’s Evenness index (H = 4.725, p = 0.03), and Faith’s PD index (H = 0.487, p = 0.485). Comparing all patients with psychiatric disorders to HC, the Shannon index (H = 6.893, p = 0.009), observed species (H = 4.867, p = 0.027), and Pielou’s Evenness index (H = 5.293, p = 0.021) revealed a significant, transdiagnostic decrease in alpha diversity metrics in the psychiatric disorder group, except Faith’s PD index (H = 3.463, p = 0.063) (shown in Fig. 1). Furthermore, no differences were observed in alpha diversity metrics comparing patients with good sleep quality and poor sleep quality (for detailed results, see “Sleep Quality and Differential Abundances” below).

Alpha diversity indices as in the Shannon index (a), observed species (b), Pielou’s Evenness (c), and Faith’s PD (d) are visualized in boxplots and labeled on the y-axis and compared between HC and psychiatric diagnosis groups.
Alpha diversity indices as in the Shannon index (a), observed species (b), Pielou’s Evenness (c), and Faith’s PD (d) are visualized in boxplots and labeled on the y-axis and compared between HC and psychiatric diagnosis groups.
Beta Diversity
To depict phylogenetic distances between samples, Bray-Curtis dissimilarity and Jaccard dissimilarity were calculated and then visualized in a principal coordinate analysis plot (shown in Fig. 2). ANOSIM revealed significant differences comparing the MDD and HC groups in Bray-Curtis dissimilarity (R = 0.119, p = 0.002) and Jaccard dissimilarity (R = 0.104, p = 0.002). Significant differences were observed between psychotic disorder and HC in Bray-Curtis dissimilarity (R = 0.299, p = 0.001) and Jaccard dissimilarity (R = 0.234, p = 0.002). Additionally, ANOSIM was performed based on unweighted and weighted UniFrac distance matrices comparing within-group differences and between-group differences in microbiome structure in patients and HC. ANOSIM revealed a significant difference in weighted UniFrac comparing the MDD group to HC (R = 0.119, p = 0.002), as well as comparing the psychotic disorder group to HC (R = 0.3, p = 0.001). Furthermore, ANOSIM showed a significant difference in unweighted UniFrac between patients with psychotic disorders and HC (R = 0.129, p = 0.022). There were no significant differences observed between MDD and HC (R = 0.04, p = 0.072). No significant differences in Bray-Curtis (R = 0.084, p = 0.178) dissimilarity, Jaccard dissimilarity (R = 0.047, p = 0.280), weighted (R = 0.084, p = 0.178) and unweighted UniFrac (R = 0.033, p = 0.277) distance measures were found between the BD and HC groups.

Beta diversity visualized as principal coordinate analysis (PCoA) plot based on Bray-Curtis dissimilarity (a) and Jaccard dissimilarity (b).
Beta diversity visualized as principal coordinate analysis (PCoA) plot based on Bray-Curtis dissimilarity (a) and Jaccard dissimilarity (b).
F/B Ratio
The F/B ratio was slightly higher in the HC group (Mdn = 5.87, IQR = [8.36]), compared to the psychiatric patient group (Mdn = 5.12, IQR = [8.34]). However, the differences were not significant (H = 6.442, p = 0.092).
Correlation Analysis of PSQI, Diversity Indices, and Clinical Parameters
All analyses were done in the patient group and HC group separately. Correlation analysis using the Spearman rho correlation coefficient for nonparametric data was performed between total PSQI score and alpha diversity indices, F/B ratio, body mass index, age and smoking habits. A rank biserial correlation coefficient was calculated between the PSQI score and alcohol consumption and sex for both groups, as well as the total PSQI score and medication regimen (groups: antidepressants, antipsychotics, mood stabilizers, hypnotics, antidiabetics, antihypertensives, anticoagulants, antiasthmatics, lipid-lowering agents, proton-pump inhibitors, thyroid medications) for the patient group only. There was no significant correlation between the total PSQI score and any of the tested variables in the patient group. Looking at the HC group, no significant correlation between the total PSQI score and clinical or diversity parameters was detectable. The coefficients and p values for analysis in the patient group are found in online supplementary Table A.1 and for the HC group, in online supplementary Table A.2.
Sleep Quality and Differential Abundances
We divided the patient group into poor-sleep quality and good-sleep quality subgroups. The demographic and clinical characteristics describing the two groups are depicted in Table 2. We observed significantly more patients with MDD in the poor-sleep quality group. For patients with BD and psychotic disorder, no significant difference between groups was found. There were no significant differences in demographic and clinical variables, including medication intake of antidepressants, antipsychotics, mood stabilizers, hypnotics, antidiabetics, antihypertensives, anticoagulants, antiasthmatics, lipid-lowering agents, proton-pump inhibitors, thyroid medications, as well as scores of alpha diversity indices comparing the good- and poor-sleep quality groups.
Demographic and clinical parameters of patient groups with good and poor sleep quality
| Parameters | Good (n = 27) | Poor (n = 36) | T/χ2/Z | p value |
|---|---|---|---|---|
| Major depressive disorder | 8 | 23 | 7.25 | 0.007* |
| Bipolar disorder | 8 | 5 | 2.33 | 0.127 |
| Psychotic disorder | 11 | 8 | 2.51 | 0.113 |
| Sex (female/male) | 16/11 | 20/16 | 0.09 | 0.769 |
| Alcohol consumption (yes/no) | 14/13 | 13/23 | 1.56 | 0.212 |
| Age, years | 41.41±12.68 | 44.25±14.86 | 0.8 | 0.427 |
| BMI, kg/m2 | 27.42±7.79 | 27.46±7.32 | −0.01 | 0.989 |
| Smoking, pack-years | 6.59±19.41 | 12.03±27.8 | −0.79 | 0.431 |
| Antidepressants (yes/no) | 19/8 | 32/4 | 3.43 | 0.064 |
| Antipsychotics (yes/no) | 21/6 | 31/5 | 0.74 | 0.389 |
| Mood stabilizers (yes/no) | 6/21 | 12/24 | 0.93 | 0.334 |
| Hypnotics (yes/no) | 7/20 | 5/31 | 1.45 | 0.229 |
| Antidiabetics (yes/no) | 1/26 | 1/35 | 0.04 | 0.836 |
| Antihypertensives (yes/no) | 4/23 | 8/28 | 0.55 | 0.459 |
| Anticoagulants (yes/no) | 3/24 | 1/35 | 1.80 | 0.179 |
| Antiasthmatics (yes/no) | 1/26 | 2/34 | 0.09 | 0.757 |
| Lipid-lowering agents (yes/no) | 2/25 | 2/34 | 0.09 | 0.765 |
| Proton-pump inhibitors (yes/no) | 4/23 | 3/33 | 0.66 | 0.418 |
| Thyroid medications (yes/no) | 1/26 | 1/35 | 0.04 | 0.836 |
| Shannon index | 5.4±0.58 | 5.32±0.73 | −0.08 | 0.934 |
| Pielou’s Evenness | 0.78±0.05 | 0.77±0.07 | −0.01 | 0.986 |
| Observed species | 128.22±36.3 | 124.83±37.41 | −0.36 | 0.72 |
| Faith’s PD | 13.78±3.36 | 13.69±3.5 | −0.04 | 0.967 |
| F/B ratio | 5.09 [8.44] | 5.12 [8.14] | −0.319 | 0.749 |
Data are presented as numbers, mean ± standard deviation, or median (interquartile range).
Differences were tested with t tests (T), χ2 tests (χ2), or Mann-Whitney U tests (Z). Statistical significance of p values is described as p < 0.05 (*) and p < 0.001 (***).
BMI, body mass index; Good, good-sleep quality patient group (PSQI ≤8); Poor, poor-sleep quality patient group (PSQI >8).
Furthermore, we used MAaslin2 to identify differentially abundant taxa between the patient group with good sleep quality and poor sleep quality based on the species and the genus levels. On the species level, we found 3 specific taxa, Ellagibacter isourolithinifaciens (coef = −0.2638, p = 0.002), Senegalimassilia faecalis (coef = −0.1355, p = 0.001), as well as uncultured Blautia sp. (coef = −0.319, p = 0.002) to be significantly enriched in the good-sleep quality patients, compared to poor-sleep quality patients. The differences between groups are visualized in Figure 3, with another boxplot showing differential abundances in HC for reference. No significant enrichment in species was found in poor-sleep quality patients compared to good-sleep quality patients.

Visualization of differentially abundant species, Ellagibacter isourolithinifaciens (a), Senegalimassilia faecalis (b), and uncultured Blautia sp. (c), in boxplots between controls, good-sleep quality patients (good), and poor-sleep quality patients (poor). Y-axis is labeled with the investigated species name.
Visualization of differentially abundant species, Ellagibacter isourolithinifaciens (a), Senegalimassilia faecalis (b), and uncultured Blautia sp. (c), in boxplots between controls, good-sleep quality patients (good), and poor-sleep quality patients (poor). Y-axis is labeled with the investigated species name.
Looking at the genus level, there was one significantly abundant genus Senegalimassilia (coef = −0.249, p= <0.001) in the good-sleep quality patients, compared to the poor-sleep quality group. An uncultured Muribaculaceae genus (coef = −0.163, p = 0.001) that was matched to Muribaculaceae on the family level was also found to be enriched in the good-sleep quality group compared to poor-sleep quality patients. In Figure 4, boxplots are offered for visual comparison between groups, as well as for HC. No significant enrichment in genera was found in poor-sleep quality patients compared to good-sleep quality patients.
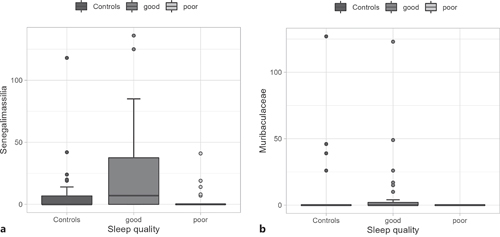
Visualization of differentially abundant genera, Senegalimassilia (a) and uncultured Muribaculaceae genus (b) in boxplots between controls, good-sleep quality patients (good), and poor-sleep quality patients (poor). Y-axis is labeled with the investigated genus name.
Visualization of differentially abundant genera, Senegalimassilia (a) and uncultured Muribaculaceae genus (b) in boxplots between controls, good-sleep quality patients (good), and poor-sleep quality patients (poor). Y-axis is labeled with the investigated genus name.
Discussion
In summary, our results show significant differences in microbiome composition and sleep quality between patients with major psychiatric disorders, namely, affective disorders and psychosis, and HC. We observed significant differences across alpha diversity and beta diversity indices comparing individuals with psychotic disorders and patients with MDD to HC. No significant differences were found between HC and BD. Three species, Ellagibacter isourolithinifaciens, Senegalimassilia faecalis, and uncultured Blautia sp., were associated with good sleep quality in the patient group, in contrast to patients with poor sleep quality. Two genera, Senegalimassilia and uncultured Muribaculaceae genus, showed significant enrichment in good-sleep quality patients as opposed to the poor-sleep quality patient group.
Significantly lower scores in alpha diversity measurements, showing differences in microbiome composition of patients with MDD compared to HC, are in line with results of other studies [53, 54]. However, these results are not homogenous across the literature [55, 56]. A recent meta-analysis revealed no significant differences regarding alpha diversity indices in patients with MDD [57]. Microbiome composition can vary significantly across different geographic locations, dietary habits, and ethnicities, which may partially explain some differences [58]. Our findings of decreased alpha diversity in patients with psychotic disorders are similar to previous results [59]. At the same time, there have been studies with contrary findings [60‒62]. BD was not associated with significant differences in alpha diversity or beta diversity, which has also been the case in earlier investigations of our research team [63]. As for beta diversity, the dissimilarity between HC and MDD, as well as HC and patients with psychotic disorders were consistent with the results of a recent meta-analysis [36]. Interestingly, despite the shared characteristics of depressive episodes in MDD and BD, the microbiome composition shows differences between the groups across alpha and beta diversity indices when compared to HC. This might further suggest potential differences in the underlying pathophysiology of MDD and BD despite their commonly shared symptoms. However, comparison of the results between studies is limited by the wide variety of techniques available for analysis, primer usage, bioinformatic processing, and differences in used diversity indices, demonstrating a need for methodical standardization across the field of microbiome research. Findings suggest that more diversity in the gut microbiome means better overall health. A transdiagnostic diversity decrease across psychiatric diagnoses is interesting as a potential mechanism to explain commonly shared symptoms in the future [64].
Medication intake of antidepressants, antipsychotics, mood stabilizers, or hypnotics has been demonstrated in previous studies to facilitate changes in microbiome diversity metrics, potentially explaining the differences in diversity metrics between patients and HC in our sample [65, 66]. A novel suggested mechanism is the biotransformation of medication by the gut microbiota, encapsulated with the term pharmacomicrobiomics [67]. There is preliminary evidence that different pharmacologic agents interact with specific gut microbiota, resulting in changes in pharmacokinetics, effectiveness, and side effects [68]. As dietary patterns can profoundly shape the microbiota composition, the Westernized diet and unhealthy eating habits of patients with psychiatric disorders are another possible explanation [69, 70]. It has been commonly observed that patients suffering from depression struggle to maintain healthy eating habits, especially in the acute state, patients prefer a Western diet with a lot of convenient food over a healthy diet with high fiber content [71].
Alpha diversity and the F/B ratio were previously observed to be positively associated with sleep efficiency in healthy individuals [72, 73]. The same positive correlation with sleep quality has been demonstrated quite recently in patients with MDD [55]. To our knowledge, this is the first study investigating sleep quality and microbiome diversity in patients with BD and patients suffering from psychotic disorders.
Nevertheless, we could not replicate prior findings when correlating the total PSQI score and alpha diversity indices, as well as the PSQI and F/B ratio, neither in the psychiatric disorder group nor in HC. However, the lack of statistical significance could very well be caused by our sample size. Interestingly, none of our clinical variables including medication intake sufficiently explained the differences in good and poor sleep quality in patients with psychiatric disorders, except a diagnosis of depression which was expected, and the significantly increased abundances of specific species and genera in the good-sleep quality group. Further, the enrichment of the previously mentioned species and genera was more prominent in the good sleep-quality patients than in poor-sleep quality patients, as well as HC. This is potentially influenced by progression, duration, or severity of disease. Additionally, as we did not collect data regarding the intake of nutritional and probiotic supplements, individuals with psychiatric disorder might be more likely to use nutritional or probiotic supplements to try and improve their clinical symptoms, compared to HC. Probiotics can affect the gut health by production of neuroactive and immunomodulatory compounds including SCFAs, secondary bile acids, and neurotransmitters, several of them being considered as sleep promoting (gamma-aminobutyric acid, melatonin) or wakefulness-promoting (serotonin, orexin, histamine, cortisol). Some studies found that certain sleep parameters such as sleep length and latency improved after pro-, pre-, or postbiotic ingestion (i.e., by probiotics such as Lactobacilli and Bifidobacteria), but results are inconsistent because of strong between study variations [74].
As psychiatric medication intake was similar across patient groups, the differential abundances might be explained by pharmacomicrobiomic effects of medication dosage, duration of use, formulations of generic drugs, as well as individual pharmacokinetic parameters. The species Ellagibacter isourolithinifaciens is one of few that can convert ellagic acid into isourolithin A and urolithin C [75]. As gut-microbial metabolites, urolithins are known to improve mitochondrial function, induce autophagy, reduce oxidative stress, decrease neuroinflammation, inhibit monoamine oxidase A, and even attenuate memory [76‒79]. The role of urolithins in sleep, psychiatric disorders, and MGBA has, to our knowledge, not been investigated. However, a clinical trial in patients with high levels of oxidative stress identified significant improvements in insomnia, fatigue, oxidative stress, and mood in supplementary treatment with Robuvit®, an extract from wood of the French oak, Quercus robur, containing urolithins and ellagic acid as main ingredients [79]. Further studies are necessary to assess the role of urolithins in sleep disturbances and psychiatric disorders.
The genus Blautia, which was associated with good sleep quality in our sample of patients with psychiatric disorders, is known to produce SCFAs, more concretely butyrate [72]. Butyrate may enhance sleep and play a role in inducing sleep, as observed in animal models [80]. More precisely, Szentirmai et al. [80] could demonstrate that an orally administered prodrug of butyrate showed an increase in non-rapid-eye movement sleep, suggesting a possible effect on sleep modulation in an animal model. The main quantity of intestinal butyrate production emerges from Firmicutes, particularly Faecalibacterium prausnitzii and Clostridium leptum[81, 82]. Interestingly, Blautia was already positively associated with sleep quality in healthy individuals [73]. In patients with MDD, the butyrate-producing genera Blautia, Coprococcus, Dorea, and Intestinibacter were inversely correlated with sleep quality [55]. Another study demonstrated a negative correlation between the total PSQI score and relative abundance of Blautia in patients with MDD and a positive association with sleep quality, consistent with our findings [55].
Senegalimassilia faecalis can convert the isoflavone dasalazin into equol and metabolize genistein [83]. As phytoestrogens, these substances are traditionally used to milden postmenopausal symptoms in women [84]. However, antidepressive, anti-atherogenic, and anti-obesity-like effects have been described as well [85, 86]. Interestingly and in line with the higher relative abundance in patients with good sleep quality in our study, a randomized controlled trial investigating the quality of life in postmenopausal women, equol supplementation led to significantly increased sleep quality and general quality of life across different metrics [87].
Uncultured genus Muribaculaceae was attributed to the family Muribaculaceae, which is a family usually observed in mouse models due to their high prevalence of about 67% in contrast to an average prevalence of 7% in human gut samples [88]. A negative correlation between systemic inflammation and Muribaculaceae has been established in animal models [89]. Depletion in relative abundance has been associated with generalized anxiety disorder in human fecal samples [90]. Nevertheless, sufficient information to explain its association with sleep quality is still scarce.
Limitations
Interpreting our results should be done by keeping the cross-sectional and cross-disorder study design in mind. Moreover, data from longitudinal trials are essential to broaden our understanding of the relationship between gut microbiome composition and sleep quality in psychiatric disorders, which we plan to incorporate in future study designs to address this limitation. In addition, the power of our study was limited by the sample size for each psychiatric diagnosis subgroup, showing the need for more extensive trials. However, sleep problems are found across all psychiatric disorders, and the cross-disorder approach helps in revealing the pathogenesis of symptoms that are occurring transdiagnostically, which can support to think outside the box. As we know from genetics studies, Kraepelin’s duality is no longer a strong boundary, and cross-disorder studies can help to uncover mechanisms that are broadly distributed in Psychiatry. A replication in drug-free patients is necessary to eliminate but also to further explore the potential effects of medication intake on the microbiome diversity metrics. Nevertheless, all patients had the same environmental conditions at the hospital, and all patients were treated with standard care, which synchronizes at least the environmental factors.
Due to cost-effectiveness, it was only possible to use 16S rRNA sequencing for analyzing stool samples instead of the more expensive but methodically superior shotgun sequencing. It is planned to build upon those findings using a metabolomics approach (nuclear magnetic resonance spectroscopy) in a future analysis to identify the actual bacterial metabolite levels (e.g., butyrate) in our sample, compared to the hypothesized metabolites produced by the enriched species and genera.
In summary, this pilot project presents the preliminary results of the first and ongoing largest Austrian multi-omics study approach in the molecular psychiatric field. In the future, we aim to recruit 1,000 patients within 10 years and further elucidate the concatenation between gut-bacteria diversity and disturbances in the circadian rhythm in follow-up projects.
Conclusions
The research presented here broadens the knowledge about the differences in the relative abundance of bacterial species in the gut and sleep quality measured with the PSQI. Three species, namely, Ellagibacter isourolithinifaciens, Senegalimassilia faecalis, and uncultured Blautia sp., were associated with good sleep quality. The observed transdiagnostic reduced alpha diversity in patients with a psychiatric diagnosis also implicates the need for implementing nutritional psychiatric interventions as the microbiome in the gut is closely interlinked with diet. In general, symptoms of psychiatric disorders such as sleep disorders extend over multiple diagnostic domains. For developing a full picture of the interconnection between the microbiome in the gut and sleep disturbances, additional studies in a cross-sectionally and longitudinally setting are needed. In addition to diversity and abundance metrics, a metabolomics approach could further elucidate the function of bacterial metabolites on sleep quality and open up new diagnostic and therapeutic pathways for improving sleep quality. Future trials are warranted, investigating the efficacy of probiotic supplementation of the enriched species and genera mentioned above in improving sleep quality in individuals with psychiatric disorders. In the future, comprehensive knowledge about the complex epigenetic modifications of the MGBA by the gut microbiota and its functional metabolites can form a foundation for developing a tailored probiotic approach for treating sleep disturbances.
Acknowledgments
We want to thank all our participants, who made this investigation possible.
Statement of Ethics
The study was conducted in accordance with the Declaration of Helsinki and approved by the Local Ethics Committee of the Medical University of Graz, Austria (EK 32-651 ex 19/20). Written informed consent was obtained from all participants before entering the study.
Conflict of Interest Statement
The authors have no conflicts of interest to declare.
Funding Sources
This research was funded by the Medical University of Graz.
Author Contributions
Marco Mairinger: conceptualization, software, formal analysis, resources, data curation, writing – original draft, visualization, and funding acquisition; Alexander Maget: investigation, resources, data curation, funding acquisition, and writing – review and editing; Jolana Wagner-Skacel: conceptualization, resources, data curation, and writing – review and editing; Sabrina Mörkl: conceptualization, validation, resources, data curation, and writing – original draft, review, and editing; Nina Dalkner: validation, resources, data curation, and writing – review and editing; Teresa Hellinger, Frederike Fellendorf, Alexandra Krammer, Anna Holl, Franziska Schmiedhofer, Adelina Tmava-Berisha, and Omid Amouzadeh-Ghadikolai: investigation, resources, data curation, and writing – review and editing; Armin Birner, Martina Platzer, Kathrin Kreuzer, Robert Queissner, Bernd Reininghaus, Melanie Lenger, Karin Fabisch, Alexandra Kohlhammer-Dohr, Annamaria Painold, Alfred Häussl, Tatjana Maria Stross, Sabine Marinschek, Julian Wenninger, Carlo Hamm, René Pilz, Michael Lehofer, and Eva Reininghaus: resources, data curation, and writing – review and editing; Werner Fitz: methodology, investigation, resources, data curation, and writing – review and editing; Karoline Pahsini and Birgit Gallé: formal analysis, resources, data curation, and writing – review and editing; Angela Horvath: methodology, software, formal analysis, resources, data curation, writing – review and editing, and visualization; Gudrun Kainz: formal analysis, resources, data curation, and writing – original draft, review, and editing; Timothy Dinan and Mary Butler: resources and writing – review and editing; Susanne Astrid Bengesser: conceptualization, methodology, validation, resources, data curation, writing – original draft, review, and editing.
Data Availability Statement
Gut microbiome data are publicly available at the NCBI Sequence Read Archive (SRA) under the BioProject accession PRJNA845887. The analyzed dataset that supports the findings of this study is not publicly available due to ethical reasons but can be requested from the corresponding author.
References

