


Elevated glycolytic enzymes in renal glomeruli correlated with preservation of renal function in the Medalist Study, individuals with ≥50 years of type 1 diabetes. Specifically, pyruvate kinase M2 (PKM2) activation protected insulin-deficient diabetic mice from hyperglycemia-induced glomerular pathology. This study aims to extend these findings in a separate cohort of individuals with type 1 and type 2 diabetes and discover new circulatory biomarkers for renal protection through proteomics and metabolomics of Medalists’ plasma. We hypothesize that increased glycolytic flux and improved mitochondrial biogenesis will halt the progression of diabetic nephropathy.
Immunoblots analyzed selected glycolytic and mitochondrial enzymes in postmortem glomeruli of non-Medalists with type 1 diabetes (n = 15), type 2 diabetes (n = 19), and no diabetes (n = 5). Plasma proteomic (SOMAscan) (n = 180) and metabolomic screens (n = 214) of Medalists with and without stage 3b chronic kidney disease (CKD) were conducted and significant markers validated by ELISA.
Glycolytic (PKM1, PKM2, and ENO1) and mitochondrial (MTCO2) enzymes were significantly elevated in glomeruli of CKD− versus CKD+ individuals with type 2 diabetes. Medalists’ plasma PKM2 correlated with estimated glomerular filtration rate (r2 = 0.077; P = 0.0002). Several glucose and mitochondrial enzymes in circulation were upregulated with corresponding downregulation of toxic metabolites in CKD-protected Medalists. Amyloid precursor protein was also significantly upregulated, tumor necrosis factor receptors downregulated, and both confirmed by ELISA.
Elevation of enzymes involved in the metabolism of intracellular free glucose and its metabolites in renal glomeruli is connected to preserving kidney function in both type 1 and type 2 diabetes. The renal profile of elevated glycolytic enzymes and reduced toxic glucose metabolites is reflected in the circulation, supporting their use as biomarkers for endogenous renal protective factors in people with diabetes.
Introduction
Chronic kidney disease (CKD) is a major cause of mortality and morbidity in people with diabetes (1,2). Multiple mechanisms have been proposed to mediate hyperglycemic adverse effects, including increased production of sorbitol, methylglyoxal, diacylglycerol, reactive oxygen species, and advanced glycation end products (3–7). Although experimental data support the role of these pathways in CKD pathogenesis, clinical trials using specific inhibitors of these pathways yielded only modest results (8–10). Findings from the Joslin Medalist Study on 1,008 individuals with ≥50 years of type 1 diabetes suggest inherent protective factors against the development of CKD and other diabetes-related complications (11,12). We recently identified a cluster of enzymes of glucose metabolism, including pyruvate kinase M2 (PKM2), which may protect against hyperglycemia-induced CKD (13). PKM2, an enzyme active at the juncture of glycolysis and the Krebs cycle, was upregulated in glomeruli of CKD-protected Medalists and strongly correlated with renal function (estimated glomerular filtration rate [eGFR]). Furthermore, we observed significant upregulation of several enzymes and reduction of their corresponding metabolites in the glycolytic, aldose reductase (AR), glyoxalase, and mitochondrial pathways among the CKD-protected Medalists (13). We demonstrated that an increased glucose metabolic flux could neutralize or even lower levels of hyperglycemia-induced toxic metabolites. Moreover, PKM2-selective activator TEPP-46 reversed hyperglycemia-induced metabolic abnormalities, mitochondrial dysfunction, and renal glomerular pathology in type 1 diabetic mouse models (13).
The hypothesis of this study was that the upregulation of PKM2 and enzymes of glucose metabolism and tricarboxylic acid (TCA) cycle protecting from diabetic kidney disease as found in individuals with extreme duration of type 1 diabetes (Medalists) could be replicated and extended in two tissues, glomeruli and plasma, of people with type 1 diabetes of shorter duration and type 2 diabetes. Hence, we aimed to extend our previous findings on the elevations of glomerular PKM2 and other glycolytic enzymes in both type 1 and type 2 diabetes. Additionally, we sought to replicate the glomerular metabolomic and proteomic findings from CKD-protected Medalists by conducting similar analyses of plasma in a larger sample of Medalists and discover new markers of renal protection through these unbiased omic screens.
Research Design and Methods
The various subsets used in the various aspects of this investigation are outlined in Supplementary Fig. 1.
The Medalists
The 50-year Medalist Study recruited participants across the U.S. (n = 1,008) with well-documented ≥50 years of type 1 diabetes. Detailed clinical descriptions of the Medalist Study, including HLA genotyping and autoantibody titers, have been published previously (12–14). The Joslin Committee on Human Subjects approved the study protocol. Each participant underwent written informed consent, medical history questionnaires, and physical examinations at the Joslin Diabetes Center.
The Medalist study design and biospecimen collection have been previously described (12,13). For the plasma omic studies, CKD was defined by Chronic Kidney Disease Epidemiology Collaboration (CKD-EPI) eGFR <45 mL/min/1.73 m2 (stage 3b CKD). For immunoblotting experiments, “low eGFR category” was designated as <30 mL/min/1.73 m2 to evaluate a sufficient number of samples per group, as it was challenging to procure postmortem kidneys among those with preserved renal function because they are prioritized for organ transplantation.
Postmortem Glomeruli and Immunoblots
Postmortem glomeruli from whole kidneys of non-Medalist individuals with type 2 diabetes (n = 19), type 1 diabetes (n = 15), and no diabetes (control subjects) (n = 5) were retrieved after death to study enzymes of glucose metabolism and TCA cycle via immunoblotting (Supplementary Table 2).
Collection of kidneys was approved by Joslin’s Institutional Review Board and coordinated by the National Disease Research Interchange or the International Institute for the Advancement of Medicine; both use a human tissue collection protocol approved by a managerial committee and subject to oversight by the National Institutes of Health. Kidneys were shipped on ice and saline gauze within 10 h of death.
Each kidney was decapsulated and bisected axially, and the cortex collected, minced on ice, and passed through two different-sized (253 and 89 μm) sieves with cold PBS. Glomeruli were extracted using the 89-μm sieve, washed with PBS, and pelleted by centrifugation. The tissue for light microscopy was formalin fixed and paraffin embedded. Sections were cut (2 μm), stained (hematoxylin and eosin, periodic acid Schiff, and Masson trichrome), and graded according to the Renal Pathology Society classification of CKD by pathologists blinded to clinical data (13).
Bio-Rad Mini-PROTEAN TGX (Bio-Rad Laboratories, Hercules, CA) precast gels were used for all Western blots (antibodies detailed in Supplementary Table 1) and ImageJ software applied to quantify proteins.
Proteomics
Medalists (N = 180) with and without CKD underwent plasma proteomic analysis targeting 1,129 proteins by SOMAscan (SomaLogic, Boulder, CO), a multiplexed DNA aptamer-based assay, using specific affinity-binding reagents (SOMAmers) quantified on a custom Agilent hybridization chip (15). Aptamers were immobilized to streptavidin-coated beads and incubated with samples to assay targets in a multiplexed manner.
Metabolomics
Medalists (N = 214) with and without CKD underwent plasma metabolomics by liquid chromatography mass spectrometry (Broad Institute, Cambridge, MA) (16,17), targeting 58 metabolites (sugars, lipids, fatty acids, and amino acids) from key pathways relevant to our recent study (13).
Both the metabolomic and proteomic subsets were chosen to include individuals with extreme phenotypes, including progressors (eGFR <45) with low HbA1c and resistors (eGFR >45) with high HbA1c. Sample availability in storage and cost considerations resulted in the slightly lower number sent for SomaLogic proteomic studies.
Replication and Validation of Proteomic Findings
Tumor necrosis factor receptor superfamily members 1A and 1B (TNFRSF1A and TNFRSF1B), well-known markers of CKD (18), were significantly downregulated among CKD-protected Medalists in our proteomic analysis. We validated these SOMAscan proteins by ELISA in a subset of Medalists (N = 30) to demonstrate the robustness of our findings. Novel marker amyloid precursor protein (APP), discovered from our interactome analysis, was further validated and replicated in Medalist samples (N = 159) through ELISA as described below.
Plasma Measurement of TNF-sRI and -sRII
Soluble TNFRSF1A and TNFRSF1B were immunoassayed in plasma by ELISA (EMD Millipore, Billerica, MA) according to the manufacturer’s protocols (catalog number DRT100, DRT200; R&D Systems, Minneapolis, MN). All measurements were performed in duplicate. Intra-assay coefficient of variation was <5% for both. Assay protocols have been previously described (18).
Urinary Assessment of KIM-1
KIM-1, a marker of tubular injury, was assessed in urine samples of the same subset of Medalists (N = 30) described above. Measurements were conducted on the Luminex platform with a magnetic bead-enhanced, sandwich-type immunoassay with Human Kidney Toxicity Panel 3 (catalog number HKTX3MAG-38 K; EMD Millipore). All measurements were performed in duplicate. Intra-assay coefficient of variation was <5%. Assay protocols have been previously described (18).
Assessment of Plasma APP
Plasma APP was measured by human ELISA Kit (catalog number DY850; R&D Systems) according to protocol. Briefly, an ELISA 96-well plate was coated with a 100 μL of polyclonal APP capture antibody in filtered PBS (4 μg/mL/well) and incubated overnight at room temperature (RT). The plate was washed with 400 μL/well of washing buffer (0.05% Tween-20) and blocked with 300 μL/well of dilution buffer (1% BSA in PBS) for 30 min at RT. Duplicates of 100 μL of serially diluted recombinant human APP peptides from 50 ng to 0.2 ng/mL as a standard, plasma samples from Medalists, IgG (0.1 μg/mL), and albumin (0.1 μg/mL) as negative controls were all loaded on the same plate. After a 2-h incubation at RT, the plate was washed and incubated with 100 μL of biotinylated APP detection antibody (1 μg/mL/well) for 2 h at RT, then washed, incubated with 100 μL of streptavidin-HRP (1:200; R&D Systems) for 30 min at RT, and finally incubated with 100 μL/well of tetramethylbenzidine for 10–20 min at RT. The reaction was stopped with 50 μL of 1 mol/L H2SO4, and absorbance was read at 450 or 560 nm using the Plate Reader (Promega, Madison, WI). Assay sensitivity and specificity were validated using human IgG, BSA, and mouse/rat plasma (Supplementary Fig. 2).
Statistical Analysis
Distributions of variables were examined to determine appropriate statistical methods. Differences between groups were analyzed with Student t, Mann-Whitney U, Kruskal-Wallis, or ANOVA tests, as appropriate. Proportions within and between groups were compared using χ2 tests. For continuous outcomes, linear regression models were run with appropriate adjustments. Analyses were performed using SAS v9.4 (SAS Institute, Cary, NC) with significance threshold P value <0.05 for assessing group differences in baseline characteristics. For assessing group differences in the immunoblotting experiments, while a significance threshold of P < 0.05 was set, we also applied a suggestive significance threshold of P < 0.10 due to the smaller number of samples and challenge of procuring postmortem kidney specimens.
Proteomics and Metabolomics Bioinformatics
The SOMAscan data were log2-transformed to normalize distributions. For metabolomics, missing data were imputed using half of the minimum across all samples for that metabolite. Metabolites not present in at least 20% of the samples were filtered out, and data were log2-transformed. Differential abundances of proteins among CKD-negative versus CKD-positive individuals were calculated using the linear modeling R-package limma (19). Multiple testing corrections were applied using Benjamin and Hochberg false discovery rate (FDR) <0.05 for significance (20). Volcano plots were plotted by R-package ggplot2. Pathway analysis was done via limma ROAST method (21).
The integrated SOMAscan and metabolite interaction network analysis included proteins related to PKM2 and analytes with between-group FDR ≤5 × 10⁻⁵. Isolated nodes in the network were removed. The global network was derived from Pathway Commons and plotted by R-package igraph (22,23).
Out of the 14 enzymes of glucose and TCA pathways earlier identified by mass spectrometry in glomeruli of CKD-protected Medalists (13), six were detected by the SOMAscan, letting us validate and replicate our previous findings, now by means of different individuals, different tissues (plasma), and different methods (SOMAscan). Simultaneously, the unbiased proteomic screen allowed for uncovering new markers of renal protection in type 1 diabetes.
Results
Key Enzymes of Glucose Metabolism in Postmortem Renal Glomeruli
Selected enzymes of glucose metabolism (glycolytic, AR, and glyoxalase pathways) and TCA cycle were studied in postmortem glomeruli of individuals with type 2 diabetes (n = 19), type 1 diabetes (n = 15), and no diabetes (control) (n = 5) via immunoblotting (Supplementary Table 2). Individuals with type 2 diabetes had shorter diabetes duration compared with those with type 1 (P < 0.001). Average eGFR was 40.0, 24.6, and 69.6 mL/min/1.73 m2 among those with type 2 diabetes, type 1 diabetes, and no diabetes, respectively (P = 0.23). No significant differences were found for sex, age, or BMI (Supplementary Table 2). Glomerular enzyme levels were compared in individuals with high eGFR (≥30 mL/min/1.73 m2) versus low (<30 mL/min/1.73 m2). In type 2 and type 1 diabetes, respectively, median (interquartile range) eGFRs were 57.5 (42.7–77.6) mL/min/1.73 m2 and 76.2 (48.7–91.6) mL/min/1.73 m2 in the high groups and 14.9 (8.8–28.1) and 13.8 (11.9–19.6) mL/min/1.73 m2 in the low groups.
Histological CKD classifications included no-to-mild [0–IIA] versus moderate-to-severe [IIB–IV] CKD (Supplementary Table 2). All control subjects without diabetes were scored as no-to-mild CKD in their renal specimens. In type 2 diabetes, 14 individuals had no-to-mild and 5 had moderate-to-severe CKD. In type 1 diabetes, six had no-to-mild and eight had moderate-to-severe CKD. A good structural–functional association between eGFR and histological CKD grading was observed, as shown by median (interquartile range) eGFR of 57.0 (28.1–76.2) mL/min/1.73 m2 in the no-to-mild group and 13.2 (9.3–32.2) mL/min/1.73 m2 in the moderate-to-severe group (P < 0.01).
PKM2 expression was lower in individuals with type 2 diabetes versus control subjects, with a trend toward significance (P = 0.08) (Fig. 1A). Compared with control subjects, other enzymes in glycolytic (PKM1, TPI1, and ENO1), TCA (MTCO2), AR, and glyoxalase pathways were decreased in both type 2 and type 1 diabetes (P < 0.05) (Fig. 1B–H).

Western blots of glomeruli of individuals with and without diabetes. PKM2 (A), PKM1 (B), GAPDH (C), TPI1 (D), ENO1 (E), MTCO2 (F), AR (G), and GLO1 (H) are shown. Data are mean ± SD. Differences by Student t test. Human glomeruli samples were prepared and Western blotting was performed as previously described (13). A total of 30 μg protein from the lysate was resolved by 10% SDS-PAGE using Bio-Rad Mini-PROTEAN TGX (Bio-Rad Laboratories) precast gels. Control, participant without diabetes; high, eGFR ≥30 mL/min/1.73 m2; low, eGFR <30 mL/min/1.73 m2; T1, type 1 diabetes; T2, type 2 diabetes.
Western blots of glomeruli of individuals with and without diabetes. PKM2 (A), PKM1 (B), GAPDH (C), TPI1 (D), ENO1 (E), MTCO2 (F), AR (G), and GLO1 (H) are shown. Data are mean ± SD. Differences by Student t test. Human glomeruli samples were prepared and Western blotting was performed as previously described (13). A total of 30 μg protein from the lysate was resolved by 10% SDS-PAGE using Bio-Rad Mini-PROTEAN TGX (Bio-Rad Laboratories) precast gels. Control, participant without diabetes; high, eGFR ≥30 mL/min/1.73 m2; low, eGFR <30 mL/min/1.73 m2; T1, type 1 diabetes; T2, type 2 diabetes.
In type 2 diabetes, PKM2 was trending toward significantly lower levels in those with severe CKD versus those with persisting renal function (P = 0.07) (Fig. 1A). Similarly, levels of PKM1 and ENO1 were also significantly decreased in those with severe CKD (P < 0.05 for PKM1 and ENO1), whereas GLO1 reached suggestive significance (P = 0.07) (Fig. 1B–H).
Expressions of TPI1 and GLO1 were higher in type 2 individuals with histologically graded no-to-mild CKD compared with those with moderate-to-severe CKD (P = 0.06 and P = 0.03, respectively). No other differences were observed among the histological classes.
Plasma Proteomics and Metabolomics Among CKD-Protected Individuals
Proteomics (SOMAscan)
Compared with those without proteomics data, Medalists in the SOMAscan set were older and had longer duration of diabetes; higher BMI, HbA1c, triglycerides, and albumin-to-creatinine ratio (ACR); lower HDL and eGFR; and greater prevalence of cardiovascular disease (CVD), proliferative diabetic retinopathy (PDR), and detectable C-peptide levels, with lower exercise rates (Supplementary Table 3).
Compared with the CKD-negative group, CKD-positive individuals included in the SOMAscan had higher rates of CVD, PDR, and antihypertensive treatment and had lower exercise rates, HbA1c, HDL, and detectable C-peptide levels (Table 1). By definition, eGFR was lower (P < 0.001) and ACR higher (P < 0.001) in the CKD-positive group.
Baseline clinical characteristics of participants in the SOMAscan
| Characteristic | No CKD (N = 96) | CKD (N = 84) | P value |
|---|---|---|---|
| Male, N (%) | 51 (52.58) | 38 (42.70) | 0.29 |
| Duration (years) | 54.66 (5.43) | 56.26 (6.92) | 0.10 |
| Age (years) | 66.2 (7.49) | 67.35 (7.61) | 0.34 |
| Insulin dose (units/kg) | 0.46 (0.14) | 0.46 (0.19) | 0.90 |
| BMI (kg/m2) | 26.29 (4.16) | 28.22 (6.06) | 0.02 |
| HbA1c (%) | 7.63 (0.69) | 7.29 (1.02) | 0.01 |
| HbA1c (mmol/mol) | 59.92 (7.57) | 56.15 (11.10) | 0.01 |
| LDLc (mg/dL) | 84.71 (23.99) | 80.5 (27.05) | 0.32 |
| LDLc (mmol/L) | 2.19 (0.62) | 2.1 (0.7) | 0.32 |
| Total cholesterol (mg/dL) | 164.46 (32.87) | 158.38 (37.16) | 0.28 |
| Total cholesterol (mmol/L) | 4.26 (0.85) | 4.1 (0.96) | 0.28 |
| Triglycerides (mg/dL) | 68.82 (29.15) | 98.52 (52.47) | <0.001 |
| Triglycerides (mmol/L) | 0.78 (0.33) | 1.11 (0.59) | <0.001 |
| HDLc (mg/dL) | 66.25 (21.14) | 57.89 (21.29) | 0.01 |
| HDLc (mmol/L) | 1.72 (0.55) | 1.5 (0.55) | 0.01 |
| eGFR (mL/min/1.73 m2) | 76.63 (15.97) | 35.84 (7.88) | <0.001 |
| ACR (μg/mg) | 39.23 (103.90) | 208.79 (650.71) | <0.001 |
| ACR (mg/mmol) | 4.44 (11.75) | 23.62 (73.61) | <0.001 |
| Systolic blood pressure (mmHg) | 132.2 (16.95) | 132.44 (18.08) | 0.93 |
| Diastolic blood pressure (mmHg) | 62.87 (7.58) | 63.7 (9.34) | 0.53 |
| Lipid-lowering medication, N (%) | 68 (72.32) | 60 (74.07) | 0.87 |
| Hypertensive medication, N (%) | 56 (59.57) | 66 (81.48) | 0.002 |
| Detectable C-peptide, N (%) | 49 (50.52) | 27 (33.33) | 0.01 |
| CVD, N (%) | 37 (39.78) | 50 (60.98) | 0.03 |
| PDR, N (%) | 41 (52.56) | 47 (73.44) | 0.01 |
| Neuropathy, N (%) | 73 (80.22) | 54 (68.35) | 0.08 |
Data are mean (SD) for continuous variables unless otherwise noted. CKD is stage 3b, as defined by CKD-EPI eGFR <45 mL/min/1.73 m2. HDLc, HDL cholesterol; LDLc, LDL cholesterol.
Of 1,129 investigated plasma proteins, 162 were significantly downregulated and 140 upregulated in the CKD-protected Medalists compared with those with CKD (FDR <0.05) (Fig. 2A and Supplementary Tables 5 and 6). Plasma SOMAscan detected 6 of the 14 differentially regulated enzymes of the glucose and TCA pathways observed in our previous glomerular mass-spectrometry studies (13). Confirming the results of the glomerular mass spectrometry and immunoblot analysis described above in a separate group of individuals with type 1 and type 2 diabetes, PKM2, TPI1, LDHB, and PGM1 were significantly upregulated in CKD-protected Medalists (FDR <0.05) (Supplementary Table 4), while GAPDH and cytochrome c showed a similar trend but did not reach statistical significance. As expected, many downregulated proteins in the unbiased screen were known markers of renal damage including cystatin C, β2-microglobulin, neutrophil gelatinase-associated lipocalin (NGAL), and TNFRs (FDR <0.05) (Supplementary Table 6).
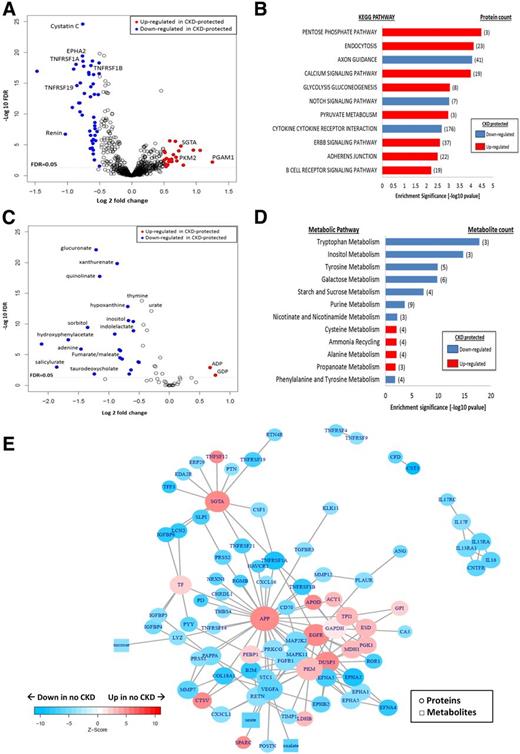
Plasma proteomics and metabolomics among CKD-protected Medalists vs. those with CKD. A: Plasma proteomics (volcano plot): fold differences between the protected (n = 96) and nonprotected (n = 84) groups (x-axis) are plotted against −log10 FDRs. Proteins of interest (glucose metabolism, glycolysis, pathways, and renal markers) are presented as blue (downregulated) and red (upregulated) circles. All other proteins are presented as white circles. Proteomic profiling of plasma samples from 180 Medalists evaluated a total of 1,129 proteins. B: Proteomic pathway analysis: most significant pathways shown (FDR <0.05). Red bars indicate upregulated pathways in CKD-protected Medalists, and blue bars represent downregulated pathways. C: Plasma metabolomics (volcano plot): fold differences between the protected (n = 157) and nonprotected (n = 57) groups (x-axis) are plotted against −log10 FDRs. Metabolites of interest (glucose metabolism, glycolysis, TCA, and purine pathways) are presented as blue (downregulated) and red (upregulated) circles. All other metabolites are presented as white circles. Metabolomic profiling of plasma samples from 214 Medalists evaluated a total of 59 metabolites. D: Metabolomic pathway analysis: most significant pathways shown (FDR <0.05). Red bars indicate upregulated pathways in CKD-protected Medalists, and blue bars represent downregulated pathways. E: Network analysis: subnetworks connecting proteins and metabolites significantly up- and downregulated in CKD-protected Medalists. Network shows proteins (circles) and metabolites (squares) presented as blue (downregulated) and red (upregulated). Nodes with FDR ≤5 × 10⁻⁵ in no CKD vs. CKD and hexoses are included in the subnetworks. Isolated nodes were removed. KEGG, Kyoto Encyclopedia of Genes and Genomes. CKD is stage 3b, as defined by CKD-EPI eGFR <45 mL/min/1.73 m2.
Plasma proteomics and metabolomics among CKD-protected Medalists vs. those with CKD. A: Plasma proteomics (volcano plot): fold differences between the protected (n = 96) and nonprotected (n = 84) groups (x-axis) are plotted against −log10 FDRs. Proteins of interest (glucose metabolism, glycolysis, pathways, and renal markers) are presented as blue (downregulated) and red (upregulated) circles. All other proteins are presented as white circles. Proteomic profiling of plasma samples from 180 Medalists evaluated a total of 1,129 proteins. B: Proteomic pathway analysis: most significant pathways shown (FDR <0.05). Red bars indicate upregulated pathways in CKD-protected Medalists, and blue bars represent downregulated pathways. C: Plasma metabolomics (volcano plot): fold differences between the protected (n = 157) and nonprotected (n = 57) groups (x-axis) are plotted against −log10 FDRs. Metabolites of interest (glucose metabolism, glycolysis, TCA, and purine pathways) are presented as blue (downregulated) and red (upregulated) circles. All other metabolites are presented as white circles. Metabolomic profiling of plasma samples from 214 Medalists evaluated a total of 59 metabolites. D: Metabolomic pathway analysis: most significant pathways shown (FDR <0.05). Red bars indicate upregulated pathways in CKD-protected Medalists, and blue bars represent downregulated pathways. E: Network analysis: subnetworks connecting proteins and metabolites significantly up- and downregulated in CKD-protected Medalists. Network shows proteins (circles) and metabolites (squares) presented as blue (downregulated) and red (upregulated). Nodes with FDR ≤5 × 10⁻⁵ in no CKD vs. CKD and hexoses are included in the subnetworks. Isolated nodes were removed. KEGG, Kyoto Encyclopedia of Genes and Genomes. CKD is stage 3b, as defined by CKD-EPI eGFR <45 mL/min/1.73 m2.
Plasma PKM2 in Type 1 Diabetes and CKD.
Previously, a 2.7-fold upregulation of PKM2 in glomeruli of CKD-protected Medalists was observed (13). Aforementioned, we confirmed the association between PKM2 and CKD protection by two proteomic methods in both human renal tissue (immunoblotting) and plasma (SOMAscan; FDR <0.05) in type 1 and type 2 diabetes. Additionally, plasma PKM2 correlated with ACR (r2 = 0.031; P = 0.03) and eGFR (r2 = 0.077; P = 0.0002) at baseline. Adjustments by covariates (BMI, daily insulin dose per kg, HbA1c, HDL, triglycerides, ACR, antihypertensive medication, neuropathy, CVD, PDR, and detectable C-peptide levels) in a multivariate regression analysis did not attenuate the PKM2-eGFR association (β [95% CI] 4.97 [1.57–8.36]; P = 0.01), but ACR no longer correlated significantly (data not shown). Among the CKD-negative and -positive groups, PKM2 and the other glycolytic enzymes did not correlate with ACR (Supplementary Table 7).
Pathway analysis indicated that four out of eight upregulated pathways (FDR <0.05) in the CKD-protected Medalists were involved in processing free intracellular glucose (pentose phosphate, glycolysis, gluconeogenesis, and pyruvate) (Fig. 2B). Axon guidance, notch signaling, and cytokine–cytokine receptor interaction pathways were downregulated.
Metabolomics
Although most clinical characteristics did not differ from the larger Medalist cohort, individuals (n = 214) included in metabolomic analysis had a higher proportion of males, lower HDL, diastolic blood pressure, and eGFR levels, and higher C-peptide levels than those excluded (Supplementary Table 8).
Within the metabolomics study, those with CKD were slightly younger, had lower HbA1c and HDL levels, and had higher BMI, triglycerides, and frequency of antihypertensive treatment compared with those without CKD (Supplementary Table 9). Again, by definition, the CKD-positive group had lower eGFR (P < 0.001), higher ACR (P < 0.001), and higher prevalence of CVD and PDR.
Thirty-two metabolites were downregulated, whereas two were upregulated in the CKD-protected Medalists versus those with CKD (FDR <0.05) (Fig. 2C). Further, pyruvate, a PKM2 metabolite, was higher in Medalists without CKD (fold change 1.29; P = 0.0358). Metabolites from the glycolytic (glucoronate and inositol), AR (sorbitol), and TCA (fumarate/maleate and aconitate) pathways were downregulated (FDR <0.05) in the protected individuals, validating findings from our previous study, but now in a larger cohort (n = 214 vs. 29) (Fig. 2D) (13). Metabolites from additional pathways, including tryptophan (xanthurenate and quinolinate), glucose (sebacate, lactose, and sucrose), fatty acid (suberate and hippurate), and purine (hypoxhantine and urate), were downregulated (FDR <0.05) in CKD-protected individuals, whereas metabolites of energy-generating pathways, including pyruvate, ADP, GDP, and uridine, were upregulated (FDR <0.05) (Supplementary Table 10).
As mentioned above, three (sorbitol, aconitate, and fumarate/maleate) of nine metabolites included in the metabolomic platform replicated from our previous study (13). The remaining six did not reach significance but had similar trends as our previous study: α-ketoglutarate, lactate, and phosphoenolpyruvate were upregulated in CKD-protected Medalists, while citrate, succinate, and fructose/glucose/galactose were downregulated.
In the CKD-protected Medalists, four of the significantly (FDR <0.05) downregulated pathways were involved in the processing of glucose (tryptophan, inositol, galactose, and tyrosine), whereas upregulated pathways were alanine, ammonia, cysteine, and propanoate (Fig. 2D).
Proteomic-Metabolomic Interactome
In a network analysis for significant proteins and metabolites, glucose and TCA pathways were activated in CKD-protected Medalists (Fig. 2E), as well as AR and pentose phosphate pathways. Three nodes that connected to several proteins and metabolites were upregulated in CKD-negative versus CKD-positive Medalists. These included APP (fold change 1.4; P = 3.81 × 10⁻⁶), epidermal growth factor receptor (EGFR) (fold change 1.15; P = 1.38 × 10⁻⁶), and small glutamine-rich tetratricopeptide-α (SGTA) (fold change 1.69; P = 1.39 × 10⁻⁶).
Replication and Validation of Proteomic Findings
TNFRSF1A and TNFRSF1B
There were no significant differences in baseline characteristics between SOMAscan Medalists (N = 180) and Medalists (N = 30) whose samples were assayed for TNFRSF1A and 1B (Supplementary Table 11). Among the 12 overlapping samples, there was significant correlation between the SOMAscan and ELISA measurements [TNFRSF1A: R2 = 0.77, P = 1.6 × 10⁻⁴; and TNFRSF1B: R2 = 0.88, P = 7.8 × 10⁻⁶] (Fig. 3A and B). ELISA confirmed significantly higher levels of these markers among CKD-positive (eGFR <45 mL/min/1.73 m2) compared with CKD-negative individuals (TNFRSF1A: P = 0.0003; and TNFRSF1B: P = 0.003) (Fig. 3C and D). These TNFRs inversely correlated with PKM2, but not with the other glycolytic enzymes (Supplementary Table 12).
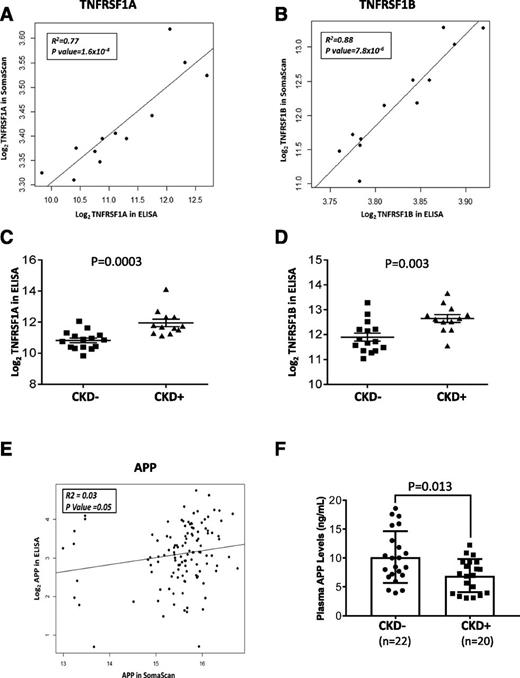
Replication and validation of SOMAscan findings: TNF-α receptors and APP ELISAs. A and B: Correlation plots of TNFRSF1A and TNFRSF1B SOMAscan vs. ELISA measurements. Markers were log2-transformed for normalization. C and D: Levels of TNF markers among Medalists with and without CKD, as measured by ELISA. Markers were log2-transformed for normalization. Student t test was used to test for significant differences between the groups. E: Correlation plot of APP SOMAscan vs. ELISA measurements. Markers were log2-transformed for normalization. F: Levels of APP among Medalists with and without CKD, as measured by ELISA. APP was log2-transformed for normalization. Student t test was used to test for significant differences between the groups. CKD is stage 3b, as defined by CKD-EPI eGFR <45 mL/min/1.73 m2.
Replication and validation of SOMAscan findings: TNF-α receptors and APP ELISAs. A and B: Correlation plots of TNFRSF1A and TNFRSF1B SOMAscan vs. ELISA measurements. Markers were log2-transformed for normalization. C and D: Levels of TNF markers among Medalists with and without CKD, as measured by ELISA. Markers were log2-transformed for normalization. Student t test was used to test for significant differences between the groups. E: Correlation plot of APP SOMAscan vs. ELISA measurements. Markers were log2-transformed for normalization. F: Levels of APP among Medalists with and without CKD, as measured by ELISA. APP was log2-transformed for normalization. Student t test was used to test for significant differences between the groups. CKD is stage 3b, as defined by CKD-EPI eGFR <45 mL/min/1.73 m2.
Markers of Tubular Damage
We assessed tubular injury marker KIM-1 in urine samples of the same subset of Medalists (N = 30) described above. KIM-1 did not correlate with eGFR (r = 0.17; P = 0.44).
APP
Because plasma APP was a major central node in our interactome analysis and significantly elevated in CKD-protected Medalists, we validated the finding via ELISA. Out of 159 samples assayed, 40 were nonoverlapping with SOMAscan samples. There were no significant differences in baseline characteristics between SOMAscan Medalists (N = 180) and the pure replication set (N = 40) (Supplementary Table 13). Among the 119 overlapping samples (validation set), there was a significant, albeit weak, correlation between the APP measurements by SOMAscan and ELISA (R2 = 0.03; P = 0.05) (Fig. 3E). In the replication set, APP ELISA levels were significantly higher among CKD-negative (eGFR >45 mL/min/1.73 m2) versus CKD-positive individuals (P = 0.01) (Fig. 3F). The validation set revealed similar findings (Supplementary Fig. 3). At baseline, APP was significantly associated with BMI, eGFR, CVD, PDR, and CKD (Supplementary Table 14). When controlling for possible confounders, PDR and CKD remained strongly associated with APP (Supplementary Table 15). Even after excluding individuals with PDR from the analysis, APP remained significantly elevated among CKD-negative versus CKD-positive individuals (estimated β = 3.12; P = 0.006). APP had a nominal inverse correlation with TNFRs (Supplementary Fig. 4). Among enzymes of glycolytic and TCA pathways, APP correlated with TPI1, LDHB, and MDH1 (Supplementary Table 16).
APP and Thrombotic Proteins
As APP has been reported to have antithrombotic activities, we examined its relationship to prothrombotic proteins in the SOMAscan. Three proteins significantly correlated inversely with APP, including thrombospondin 2 (THBS2), THBS4, and tissue factor, whereas complement C5 and platelet glycoprotein VI were positively correlated with APP (Supplementary Table 16). Of these, THBS2, THBS4, and tissue factor were significantly downregulated among CKD-protected Medalists (P < 8 × 10⁻⁷), and glycoprotein VI was significantly upregulated (P = 3 × 10⁻⁵) (Supplementary Table 17). THBS4, prominently connected to APP in the network analysis (Fig. 2E), was also significantly downregulated among Medalists without PDR compared with those with PDR (fold change −1.15; P = 0.0019) (Supplementary Table 17).
Conclusions
Our current and previous reports strongly suggest that elevated expressions of multiple enzymatic pathways of intracellular glucose metabolism are associated with CKD protection in individuals with long-standing type 1 diabetes (13). Similar to those reported in type 1 diabetes, four glycolytic enzymes (PKM1, PKM2, ENO1, and TPI1) were also upregulated in the renal glomeruli of individuals with type 2 diabetes with preserved renal function. Elevated mitochondrial enzyme (MTCO2) in individuals with type 2 diabetes without CKD suggests that preservation of mitochondrial function is important to retain kidney function and prevent glomerular pathology (24). This study also showed that expressions of both AR and glyoxalase were higher in people with type 2 diabetes with preserved renal function, confirming the previous report among CKD-protected individuals with type 1 diabetes of extreme duration (13). These findings advocate that glomerular cells, under prolonged hyperglycemic conditions, decrease or maintain intracellular glucose levels in physiological ranges by increasing flux via glycolysis and AR pathways and promote degradation of toxic glucose metabolites like methylglyoxal.
Interestingly, plasma proteomic analysis also indicated upregulation of glucose metabolism pathways (pentose phosphate, glycolytic, gluconeogenic, and pyruvate) in CKD-protected Medalists. Four of the enzymes (PKM2, TPI, LDH, and PGM1) that were elevated in CKD-protected glomeruli in our previous study were also elevated in the plasma (13). These findings of similar enzymatic changes in plasma and glomeruli in CKD protection were surprising because the contributions of these cytosolic enzymes from the glomerular cells were unlikely to be significant in the systemic circulation, suggesting that preserving physiological regulation of glucose and mitochondrial metabolism may be critical in protecting other organs in hyperglycemic conditions. Additionally, in our proteomic study, though it did not meet the significant threshold of FDR <0.05, we also found FGF23 significantly associated with CKD (fold change 1.11; P = 0.0185; FDR = 0.06). FGF23 is an exciting new biomarker shown to be part of the pathology of renal and general vascular disease and eventually mortality in these individuals (25).
Metabolomics of CKD-protected Medalists’ plasma showed reduction of metabolites that were part of the glucose/hexose (glucoronate, sorbitol, and inositol), mitochondrial (fumarate, maleate, and aconitate), amino acid (adenine and thymine), and purine degradation (urate and hypoxanthine) pathways (26). Elevations of pyruvate and ADP without parallel increases of lactate and ATP suggested preservation of oxidative phosphorylation and mitochondrial metabolism (27–30). Similarly, elevated plasma GDP suggested preserved mitochondrial functions in CKD-protected Medalists due to its actions on AMPK (31). Metabolomic pathway analysis supported the individual metabolite findings by showing downregulation of hexose, mitochondrial, amino acid, and purine pathways, which is expected in people with preserved renal function. Again, metabolomics were conducted in plasma, reinforcing the idea that pathways regulating intracellular free glucose involve multiple organs other than the kidney.
The upregulation of glucose metabolism and mitochondrial biogenesis suggest a higher ATP yield per O2 as the amount of pyruvate presented to the mitochondrial TCA is presumably elevated. This is important, especially in a hyperglycemic milieu, in which this process results in 36 ATP molecules compared with only 2 when energy is generated through aerobic glycolysis (the Warburg effect) (32–34). This may be very critical in the context of the extremely high-energy requirement of the kidney as well as considering that the kidney is extremely vulnerable to hypoxia, which has been increasingly implicated in the pathogenesis of diabetic kidney disease (35). In diabetic nephropathy, mitochondrial energetics are altered to increase reactive oxygen species, eventually causing a decrease in ATP production and an increase in apoptosis (36).
Network analysis identified several nodes of interest, such as enhancement of APP, EGFR, SGTA, and PKM2 and reduction of vascular endothelial growth factor (VEGF) in CKD-protected Medalists. Inflammatory pathways, including TNF-α receptors, were downregulated in these individuals. Some of these findings were expected, including reduced inflammatory cytokines and VEGF clusters, because elevations of these pathways have been associated with increased CKD risk (37). However, the connection of increased APP levels to decreased levels of inflammatory cytokine receptors (TNFR), as well as proliferation of related signaling (mitogen-activated protein kinase and PKCG) and VEGFA, is new and indicates that APP elevation may be a contributing factor in protection from CKD (38). Importantly, the elevated APP in CKD-negative individuals was validated through plasma ELISA assay of another distinct subset of Medalists.
The discovery of elevated APP in people without CKD is novel and interesting. Results of the network analysis seem to indicate that APP may have effects on many pathways including glucose metabolism (PKM, TPI, and GAPDH) and cell growth (EGFR and mitogen-activated protein kinase). APP, together with three amyloid precursor-like proteins, builds a family of transmembrane glycoproteins, highly expressed in the human brain, kidney, eye, and platelets (39,40). In the brain, it is thought to have a causal relationship to Alzheimer disease through amyloid plaques. The extraneural functions of APP are less well known. APP is also expressed in the kidney, although its function is unknown. APP−/− mice show impaired differentiation of both amacrine and horizontal cells, suggesting APP modulates normal neuronal development in the retina (40). In line with these experimental findings, we observed APP not only to be upregulated in CKD-protected individuals but also in those without PDR. Finally, in platelets, APP inhibits thrombin, regulating hemostasis and eventually serving as a coagulation inhibitor (41), which may partly explain the beneficial effects of APP on the vessels. In our study, APP inversely correlated with a few prothrombotic proteins, of which THBS4 was the most remarkable, as it is known to promote myocardial fibrosis and retinal angiogenesis partly through the TGF-β pathway (42,43).
Vascular endothelial APP expression increases during hyperglycemia (44) and is further enhanced by ischemia, stress, and inflammation, suggesting that APP elevations may be a response to cellular stress (39). It is possible that elevated APP in renal tissue and systemically may exert protection for vascular damage; however, APP has also been reported to promote oxidative stress and inflammation (39). Further, a previous report suggests the opposite findings that the expression of APP may be elevated in rodents with experimental diabetes (45). Clearly, more studies are needed to clarify APP’s role on renal metabolism and function.
There are multiple limitations of this study. First, not all proteins that were upregulated in our previous study in Medalists’ glomeruli were found in the plasma SOMAscan, but 50% of those included could be replicated. This is expected because the contribution of glomerular proteins to plasma proteins will be fairly low. Second, lower glycolytic proteins in glomeruli of CKD-positive individuals with type 2 diabetes is surprising, given the short duration of diabetes. It is premature to assume that only some of these individuals will be fully protected from CKD, and other factors such as good glycemic control need to be considered, but our database lacks information on HbA1c levels at the time of death of these individuals. As well, given that the postmortem results showed no difference between the control subjects and the group with type 2 diabetes with high GFR, it may suggest that in the general population, glycolytic enzymes are decreased in late stages of type 2 diabetes, rather than elevated in early stages as seen in the protected cohort of the Medalists (13). Levels of enzymes do not also necessarily reflect their activities in different stages of diabetes. Overall, however, these data support the beneficial role of increased glycolytic flux even in a general population with diabetes. Among those with a shorter duration of type 1 diabetes, we could not replicate our previous findings of increased glycolytic proteins in glomeruli of CKD-protected Medalists, perhaps because we have included a wide range of diabetes duration among the participants studied, and due to the challenge of procuring postmortem kidney specimens, we had a limited power to reach P < 0.05 for the fold changes observed in our previous publication. Based on the numbers of samples from postmortem whole kidneys the cutoff for severe renal disease was set to eGFR <30 mL/min/1.73 m2 in order to include a sufficient amount of individuals in the groups. This matter weakens the argument for comparability of the postmortem study with the omics study. It is, however, improbable that the observed results would not be valid due to this categorization, also considering that the focus was on CKD-protective proteins in those with less severe kidney disease, which would only dilute the results if anything. Third, the plasma proteomic analyses were only performed and replicated in people with long duration of type 1 diabetes. Further studies will be needed in people with shorter duration of type 1 and type 2 diabetes. Our data suggesting increased glycolytic flux and improved mitochondrial biogenesis as well as upregulation of a novel protein, APP, to protect from diabetic kidney disease in type 1 and type 2 diabetes needs to be replicated in other cohorts of diabetes. Ideally, these cohorts would comprise longitudinal blood samples and renal specimen both pre- and postmortem. Only then would the true role of these enzymes and pathways be clarified and the best protein and pathway identified for pharmacological interventions.
In summary, the combined findings from our current and past reports strongly indicate that elevation or maintenance of glucose metabolic pathways in renal glomeruli and probably other organs is important for preservation of renal function. Both proteomics and metabolomics analyses in renal glomeruli and plasma imply that the mechanism for protection against CKD appears to involve controlling intracellular free glucose and neutralizing toxic glucose metabolites. Surprisingly, elevated glycolytic enzymes, which may increase glycolytic flux, as shown previously, were associated with maintaining mitochondrial functions, opposite to previous postulations. Bioinformatic analysis of plasma proteins validated known biomarkers of CKD such as TNFRs and also suggested new potential targets including APP, which may be related to multiple glycolytic enzymes and growth-related pathways important for maintaining renal glomerular and tubular structures and functions. Further clinical studies will be needed to detect which activities of glucose pathways can be helpful in preserving renal function among individuals with diabetes.
Article Information
Acknowledgments. The Medalist Study thanks the Clinical Research Center, Joslin Diabetes Center, Boston, MA, for assistance as well as the Medalists for participating in this study. The authors also thank Jialin Fu, Joslin Diabetes Center, Boston, MA, for technical help.
Funding. The 50-Year Medalist Study is funded by the National Institute of Diabetes and Digestive and Kidney Diseases (P30-DK-036836, UL1-RR-025758-03, R24-283-DK-083957-01, DP3-DK-094333-01, and T32-DK-007260), JDRF (17-2013-310), the Tom Beatson, Jr 284 Foundation, and many Medalists. D.G. was supported by a Mary K. Iacocca Fellowship provided by the Iacocca Foundation and grants from the Wilhelm and Else Stockmann Foundation, The Medical Society of Finland (Finska Läkaresällskapet), the Finnish Medical Foundation, and the Biomedicum Helsinki Foundation.
Duality of Interest. This study was also supported by a basic research grant from Sanofi Deutschland GmbH (Frankfurt am Main, Germany). W.Q. is an employee of AstraZeneca. T.Sa. and A.K. are employees of Sanofi. H.A.K. is an employee of Sanofi-Genzyme. No other potential conflicts of interest relevant to this article were reported.
Author Contributions. D.G. and H.S. researched data, performed statistical analyses, and wrote the manuscript. T.Sh., R.S-L., and K.P. researched data, performed laboratory experiments, and contributed to the manuscript. W.Q., I-H.W., V.B., M.J.B., and L.J.T. recruited and managed the participant‐ level clinical data as well as the blood and tissue samples. S.M.P., D.M.P., J.M.D., and H.P. researched data, performed statistical analyses, and contributed to the manuscript. Y.D., T.Sa., A.K., and H.A.K. contributed to discussion and reviewed and edited the manuscript. M.A.N. supervised the TNF marker measurements and analyses. P.A. assessed all of the human kidney pathology. D.G., H.S., T.Sh., R.S-L., W.Q., K.P., S.M.P., D.M.P., I-H.W., V.B., M.J.B., L.J.T., J.M.D., H.P., Y.D., M.A.N., P.A., T.Sa., A.K., H.A.K., and G.L.K. reviewed the manuscript. G.L.K. researched data and wrote the manuscript. G.L.K. is the guarantor of this work and, as such, had full access to all of the data in the study and takes responsibility for the integrity of the data and the accuracy of the data analysis.
Prior Presentation. Parts of this study were presented at the 78th Scientific Sessions of the American Diabetes Association, Orlando, FL, 22–26 June 2018.