


Diets with high glycemic index (GI), with high glycemic load (GL), or high in all carbohydrates may predispose to higher blood glucose and insulin concentrations, glucose intolerance, and risk of type 2 diabetes. We aimed to conduct a systematic literature review and dose–response meta-analysis of evidence from prospective cohorts.
We searched the Cochrane Library, MEDLINE, MEDLINE in-process, Embase, CAB Abstracts, ISI Web of Science, and BIOSIS for prospective studies of GI, GL, and total carbohydrates in relation to risk of type 2 diabetes up to 17 July 2012. Data were extracted from 24 publications on 21 cohort studies. Studies using different exposure categories were combined on the same scale using linear and nonlinear dose–response trends. Summary relative risks (RRs) were estimated using random-effects meta-analysis.
The summary RR was 1.08 per 5 GI units (95% CI 1.02–1.15; P = 0.01), 1.03 per 20 GL units (95% CI 1.00–1.05; P = 0.02), and 0.97 per 50 g/day of carbohydrate (95% CI 0.90–1.06; P = 0.5). Dose–response trends were linear for GI and GL but more complex for total carbohydrate intake. Heterogeneity was high for all exposures (I2 >50%), partly accounted for by different covariate adjustment and length of follow-up.
Included studies were observational and should be interpreted cautiously. However, our findings are consistent with protective effects of low dietary GI and GL, quantifying the range of intakes associated with lower risk. Future research could focus on the type of sugars and other carbohydrates associated with greatest risk.
Type 2 diabetes is a leading cause of cardiovascular disease, with a global prevalence of 10% (1). An individual’s diet is considered to contribute to the development of type 2 diabetes, in particular, the capacity that foods containing carbohydrates have to increase blood glucose (2). It has been suggested that diets with high glycemic index (GI) or glycemic load (GL) may predispose to higher postprandial blood glucose and insulin concentrations, which, in turn, increase glucose intolerance and risk of eventual type 2 diabetes (3).
A number of studies have indicated an association between GI, GL, and type 2 diabetes (4–8), but there are many other large studies that find no evidence to support the hypothesis (9–11). Accordingly, the American Diabetes Association’s dietary guidelines for diabetes prevention currently state that there is insufficient consistent evidence to say that diets low in GL reduce diabetes risk (12). There is also considerable inconsistency in results regarding the role of total carbohydrate intake.
Two systematic reviews have concluded that there is evidence of a positive association between both dietary GI and GL and risk of type 2 diabetes (13,14), but with considerable unexplored heterogeneity. The comparison of only the most extreme categories, based on different definitions in each reviewed study, introduced additional heterogeneity and discarded information in the middle exposure categories, leading to uncertainty regarding the strength of the association. Combination of different definitions of the highest and lowest exposure categories meant that their summary estimates could not be related to a particular level of exposure, limiting the applicability of results in public health terms. Furthermore, the review did not assess the nature of any dose–response relationship, an important criterion for judging the chances of any associations being causal.
Results from nine publications from eight large prospective studies have been published since the most recent review, including almost 20,000 cases of type 2 diabetes from over 250,000 participants. We therefore assess the evidence accumulated to date, investigating possible dose–response curves and formally exploring the potential causes of heterogeneity that may lead to deeper understanding of the nature of the associations.
RESEARCH DESIGN AND METHODS
Data sources and searches
A comprehensive systematic literature search was conducted at the end of 2009 covering all prospective research providing evidence on all aspects of dietary carbohydrates and cardiometabolic health, including cardiovascular disease, insulin resistance, glycemic response, and obesity. The following online databases were searched for all prospective studies published in English language from 1 January 1990 to 30 November 2009: the Cochrane Library, MEDLINE, MEDLINE in-process, Embase, CAB Abstracts, ISI Web of Science, and BIOSIS. We then updated the search, using the two primary sources (MEDLINE, including MEDLINE in-process, and Embase) up to 17 July 2012. The updated search was restricted to cohort studies investigating GI, GL, total carbohydrate intake, and type 2 diabetes (detailed search strategy in Supplementary Table 1). Hand searches of key journals, with searching of reference lists from included studies and previous review articles, were also conducted. The guidelines for conducting meta-analysis of observational studies in epidemiology were used throughout the design, conduct, analysis, and reporting of this review (15). A protocol was drafted prior to starting the review (http://www.sacn.gov.uk/meetings/working_groups/carbohydrate/21092009_1.html) but is not currently available for download.
Study selection
The first round of screening of titles and abstracts was carried out by members of the review team to remove publications when it was immediately apparent they were not relevant, such as editorials, single case-study reports, and therapeutic approach articles. Prespecified guidelines were in place to ensure consistency between separate reviewers. We extracted full-text copies of potentially relevant articles, which were read independently by two members of the review team. Any disagreements were settled by a third reviewer. A structured flowchart and detailed guidelines were used to determine eligibility for inclusion.
Only cohort studies were eligible, including nested case-control studies and case-cohort studies nested within a cohort. Inclusion criteria were studies based on an adult population, published in the English language since 1990, with assessment of GI, GL, or total dietary carbohydrate intake with more than two categories of exposure, with at least some control for confounding either by adjustment in a model or matching, type 2 diabetes as an outcome, and some estimate of relative risk (RR) with a measure of uncertainty such as 95% CIs. Only studies with generally healthy participants were included, i.e., only if cohort participants were not recruited specifically because of ill health or a personal history of disease. Mean dietary exposure for cases compared with noncases were not eligible unless they were adjusted means. Results for dietary patterns were not eligible if they did not quantify intake. Gestational diabetes outcomes were not eligible. Study selection was carried out by two researchers from D.C.G., D.E.T., C.E.L.E., C.L.C., C.N., and V.J.B., with disagreements resolved by a third researcher.
For inclusion in dose–response meta-analysis, only studies publishing estimates of RR with associated CIs, alongside a quantified measure of intake, and sufficient detail regarding the numbers of cases and noncases or person-years exposure could be included.
Data extraction and quality assessment
We extracted the following information from the publications identified: authors, publication year, geographical region of the study, name by which the study is known, participants’ sex, age range or mean age of participants, study type (full cohort, nested case control, or case cohort), length of follow-up, numbers of cases and noncases, method of dietary assessment, and method of outcome assessment, level of dietary exposure (either as mean, median, midpoint, or range for each category or unit of increment for continuous estimates), the standard used to derive GI or GL (glucose or bread) estimated RRs with CIs, and characteristics controlled for either by modeling, matching, or stratification. Data extraction was carried out by D.C.G., D.E.T., C.E.L.E., C.L.C., C.N., C.W., and V.J.B., and its accuracy was checked by D.E.T. and D.C.G.
Data synthesis and analysis
To enable pooling of individual study results reported using different exposure categorization, a linear dose–response trend was derived for each study using Greenland and Longnecker’s method (16,17). This method estimates study-specific dose–response slopes and associated CIs based on the results presented for each category of GI, GL, or total dietary carbohydrate intake before combining into a pooled estimate.
To derive the dose–response trend, we used the mean or median exposure for each category if this was presented and used the midpoint when exposure ranges were presented instead. When the lowest or highest categories were unbounded, we assumed the width of the category to be the same as the adjacent category when estimating the midpoint. Greenland and Longnecker’s method also requires the distribution of cases and person-years, or cases and noncases, with RRs and estimates of uncertainty (e.g., CI) for at least three categories of quantified GI, GL, or carbohydrate intake. Where the total number of cases or person-years was presented in the publication, but not the distribution, we estimated this based on definitions of the quantiles. The estimated exposure level (based on median, mean, or midpoint) was then assigned to the corresponding RR for each study. For studies presenting the exposure per given unit of energy intake, we rescaled this using estimated energy intake for each category if this was presented.
For the studies already reporting a linear dose–response trend, with a measure of precision such as a CI or a standard error, this was used directly. Where results were only presented separately for men and women, these were first combined using a fixed effects meta-analysis before combining with other studies. This ensured that between-study heterogeneity was not underestimated. All the estimated dose–response trends for each study were then pooled using a random-effects model to take into account anticipated between-study heterogeneity (18). In presenting the linear dose–response trend, we chose an increment size approximately equivalent to one standard deviation in a European or U.S. population, to ease comparison across exposures.
To examine possible nonlinear associations, we calculated restricted cubic splines for each study with more than three categories of exposure, using three fixed knots at 10, 50, and 90% through the total distribution of reported intake then combined using multivariate meta-analysis (19–22). Four studies only presented results for a linear trend over a continuous exposure (8,10,23,24), and two studies only presented results for three categories (25,26), so these could not be included in nonlinear dose–response analyses.
We assessed between-study heterogeneity using Cochran Q test and the percentage of total variation in study estimates attributable to between-study heterogeneity (I2) (27). Rather than assess study quality using a quality score, to minimize bias from confounding, we excluded results with no adjustment for any confounding or where only unadjusted dose–response trends could only be estimated. We also tabulated the following markers of risk of bias: adequacy of the dietary assessment tool, objectivity of ascertainment of the outcome, adequacy of length of follow-up, adequacy of control for confounding, and potential competing interests. In addition, we investigated the extent to which specific study characteristics defined in advance were associated with different higher or lower estimates or how they potentially explained some of the heterogeneity. These characteristics included duration of follow-up and adjustment for prespecified confounders, which are potential indicators of study quality. Potential small study effects, such as publication bias, were investigated with contour-enhanced funnel plots. However, with small numbers of included studies, exploration of sources of heterogeneity and of small study affects lack power. All analyses were conducted using Stata version 12 (28).
RESULTS
We identified 24 publications from 21 cohort studies that reported GI, GL, total or carbohydrate intake, and incidence of type 2 diabetes (Supplementary Fig. 1). One publication could not be used in meta-analyses because it did not quantify intake (7), one could not be used because it only presented results for the highest and lowest categories (29), and one could not be used because of the form the results were presented in (30). The remaining 18 cohorts provided sufficient information for inclusion in dose–response meta-analyses (Supplementary Table 2). The risk of bias assessment is provided in Supplementary Table 3.
Nine studies were from the U.S., four from Europe, and the remainder from Australia, Japan, and China. One cohort presented results in three publications (4,31,32), so we used the data in the most recent publication (32). A further study reported GI and load in a separate paper from total carbohydrate intake (11,33). For one study to be included, we estimated standard errors using the reported P value and estimates (25). For another to be included, category means were estimated based on an assumed normal distribution, with approximate mean and standard deviation derived from the publication (34). The exclusion of studies reporting unadjusted estimates had resulted in the loss of two studies presenting results for total carbohydrate intake that would otherwise have been included (35,36).
GI
Data were extracted from 15 publications investigating the association between GI and type 2 diabetes (5,6,8–11,23–26,32,37–40) (Fig. 1A). The estimated category mean intakes ranged from approximately 45 to 90 units of GI, with individual studies spanning between 6 and 36 units. The pooled estimate of RR from linear dose–response meta-analysis was 1.08 (95% CI 1.02–1.15) per 5 units of GI (P = 0.01). There was substantial heterogeneity between the cohort studies (I2 = 87%; 95% CI 80–92%; Q = 108; df = 14; P < 0.001).
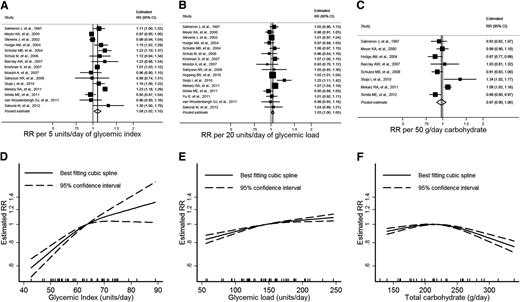
GI, GL, total carbohydrate intake, and estimated RR of type 2 diabetes. A–C: Forest plots of linear dose–response trends with pooled estimates from random-effects meta-analysis. Increments used are approximately one standard deviation. D–F: Summary nonlinear dose–response curves. The median intake is used as the reference category. Tick marks on the horizontal axis indicate the location of category medians, means, or midpoints for included studies.
GI, GL, total carbohydrate intake, and estimated RR of type 2 diabetes. A–C: Forest plots of linear dose–response trends with pooled estimates from random-effects meta-analysis. Increments used are approximately one standard deviation. D–F: Summary nonlinear dose–response curves. The median intake is used as the reference category. Tick marks on the horizontal axis indicate the location of category medians, means, or midpoints for included studies.
Studies adjusting for family history of type 2 diabetes appeared to have much higher estimates than those not adjusting (P < 0.001). The stronger association between GI and diabetes was restricted to those studies that adjusted for this, leading to improved heterogeneity within each subgroup (Supplementary Table 4). Estimates were largely consistent across the other predefined subgroups. The funnel plot was approximately symmetric, with little evidence of small-study effects such as publication bias (data not shown).
Nonlinear dose–response meta-analysis showed a consistently increasing risk associated with increased GI (Fig. 1D). There was little evidence of a threshold effect in the plot.
GL
Data were extracted from 16 publications investigating the association between GL and type 2 diabetes (5,6,8–11,23,25,26,32,34,37–41) (Fig. 1B). The estimated category mean intakes ranged from approximately 55 to 245 units of GL, with individual studies spanning between 48 and 190 units. The pooled estimate of RR from linear dose–response meta-analysis was 1.03 (95% CI 1.00–1.05) per 20 units of GL (P = 0.02). There was moderate heterogeneity between the cohort studies (I2 = 54%; 95% CI 19–74%; Q = 33; df = 15; P = 0.005).
As with GI, studies that adjusted for family history had higher estimates than those that did not adjust for this covariate (P = 0.03), with stronger associations between GL and diabetes apparent in those studies that did adjust for family history. Stratifying by family history improved heterogeneity within each subgroup (Supplementary Table 4). Longer follow-up was associated with stronger associations between GL and type 2 diabetes (P = 0.03). Estimates were largely consistent across the other predefined subgroups. The funnel plot was approximately symmetric, with little evidence of small-study effects such as publication bias (data not shown).
Nonlinear dose–response meta-analysis showed a consistently increasing risk associated with increased GL (Fig. 1E). There was little evidence of a threshold effect in the plot.
Total carbohydrate
Data were extracted from eight studies investigating total carbohydrate intake and type 2 diabetes (5,8,9,23,24,32,33,42) (Fig. 1C). The estimated category mean intakes ranged from approximately 130 to 340 g, with individual studies spanning between 72 and 210 g. The pooled estimate of RR from linear dose–response meta-analysis was 0.97 (95% CI 0.90–1.06) per 50 g per day of total dietary carbohydrate intake (P = 0.5). There was substantial heterogeneity between the cohort studies (I2 = 75%; 95% CI 50–88%; Q = 28; df = 7; P < 0.001).
Estimates were largely consistent across predefined subgroups, though there was a tendency for studies with longer follow-up to have larger estimates (Supplementary Table 4). The funnel plot was approximately symmetric, with little evidence of small-study effects such as publication bias (data not shown).
Nonlinear dose–response meta-analysis showed a relatively flat curve over a broad range of typical intakes, with a suggestion of lower risks associated with higher intakes where data are more sparse and CIs wider (Fig. 1F) and where studies had higher proportions of male participants.
CONCLUSIONS
We have quantified a clear positive association between both GI and GL with increasing incidence of type 2 diabetes. The association was stronger for GI than GL, with approximately one standard deviation of GI intake associated with more than twice the increased risk associated with GL. Compared with the data on dietary GI, the evidence base for GL is more inconsistent in terms of direction of association.
Despite use of linear dose–response trends to combine studies using different exposure categorizations, heterogeneity was still high for all exposures. Exploration of this heterogeneity by investigating the estimates in different predefined subgroups suggested that adjustment for family history of diabetes was potentially important, with studies that did not adjust for it having much lower estimates for the association between GI, GL, and type 2 diabetes.
While these findings are consistent with those of two previous systematic reviews (13,14), our review is the first to quantify the strength of the association, the first to explore some of the heterogeneity in results, the first to remove some of this heterogeneity by combining dose–response trends, and the first to investigate possible nonlinear associations. We have included results from nine publications from large prospective studies that have been published since the most recent review, and these include almost 20,000 more cases of type 2 diabetes from over 250,000 more participants, further strengthening the evidence on which our conclusions are based.
Meta-analysis of observational studies is susceptible to the same biases that the studies they contain are prone to, so the pooled estimate may still contain an element of bias to the extent that the studies reviewed are biased. In particular, all the studies reviewed used some form of self-reported dietary exposure and were therefore susceptible to potentially large measurement error. In addition, many adjusted for self-reported dietary covariates so may not have fully adjusted for true intake. This could bias the associations in either direction. Furthermore, we cannot conclusively prove that any associations are causal on the basis of observational studies alone, and there may be some uncorrected confounding in some or all of the studies. However, the estimates we have found for GI and GL are strong with clear dose–response trends, and there was no evidence of any small-study effects such as publication bias.
Given the limited nature of databases of GI values for foods, assigning a GI to an individual’s diet as captured by a food frequency questionnaire (FFQ) is potentially problematic. Typically, GI values for each food item in a questionnaire were taken from the 2002 international table of GI values of foods (43). Broad groupings of foods within each FFQ item sometimes necessitates the allocation of an average GI for that item, and this has led some to express concerns about the appropriateness of using FFQ-derived GI and GL values to explore disease associations (44). The dietary GI of a food is subject to considerable variation dependent upon the extent of processing, cooking method and duration, extent of starch gelatinization, ripeness, and storage duration (45). Further issues concern whether foods consumed together impact on each other to alter the GI of the whole meal (46). This exposure is therefore potentially prone to measurement error bias. The estimation of GL requires the additional estimate of the amount of carbohydrate in the diet, providing greater scope for dilution of results through measurement error bias.
Even though the estimated absolute values of GI and GL are probably not accurate estimates of actual values in many studies, we have still used them so that the different studies can be combined on the same scale and dose–response trends and nonlinear trends can be estimated. However, in interpreting these, the emphasis should be on the relative ranking as much as on the estimated GI and GL.
A wide range of exposures were reported across the publications, though the intakes reported by individual studies generally varied by smaller amounts. This may reflect the variety of dietary assessment tools leading to different amounts of measurement error in each study or may be because of contrasting populations, different diets, and phenotypes.
In general the GL of a diet is likely to be partly related to the dietary fiber content, and this means that it is difficult to dissociate the effects of GL from the fiber content. In the studies we reviewed, adjustment for fiber tended to be associated with larger estimates where this was done (5,6,9), suggesting that other studies may have underestimated the association, and our pooled estimate may be an underestimate. Similarly, GI and GL may reflect other aspects of dietary quality, such as saturated fat intake, with findings partly reflecting some other dietary characteristics. It is quite likely that higher carbohydrate intakes may substitute for fat or protein, while maintaining a constant energy intake. This is another example where observational studies are unable to assign causality, and it is the same with their meta-analysis.
Inconsistencies in results for total carbohydrate intake and type 2 diabetes may be due to differences in the main sources and types of carbohydrate consumed or other differences in dietary practices between European, U.S., Chinese, and Australian cohorts. It might also reflect the possibility that healthier, more active people are consuming more carbohydrates. An alternative explanation may relate to differences between both the amount of carbohydrate consumed and the type of carbohydrate eaten, with different cohorts also having different proportions of men and women.
This may also account for any nonlinear appearance of the dose–response plot, with studies reporting higher intakes of total carbohydrates having different sources of carbohydrate in the diet than those reporting lower intakes. Nonlinear dose–response curves are susceptible to cohorts with different ranges of intake, leading to the appearance of a nonlinear curve. In this situation, differences in design or population can cause the appearance of nonlinearity. However, there is a reasonable spread of carbohydrate intakes over a number of studies included in the meta-analysis, so this is unlikely to have occurred in this review.
Our findings are consistent with, and contribute to, a growing body of evidence for the protective associations with low dietary GI and GL. Our results have quantified for the first time the range of exposures associated with lower risk and quantified the risk reduction associated with specified differences in GI and GL. Results for carbohydrates, more generally, are less clear, and future research could focus in more detail on the source and composition of carbohydrates associated with greatest risk.
Acknowledgments
This work was funded by the Department of Health for England.
D.E.T. holds a PhD studentship sponsored by Kellogg’s Public Limited Company. D.C.G. holds an unrelated research grant (a study of infant diet) funded by Danone. No other potential conflicts of interest relevant to this article were reported.
Funding bodies played no part in design and conduct of the study, article selection, data management, analysis, or interpretation of the data and had no role in the preparation, review, or approval of the manuscript.
D.C.G. contributed to study design, manuscript selection, and data extraction; conducted all statistical analyses and interpretation of results; and drafted the manuscript. D.E.T. performed all literature searches and contributed to data extraction and interpretation of results. C.E.L.E., C.L.C., C.N., and C.W. contributed to data extraction and interpretation of results. V.J.B. was principal investigator, designed the study, and contributed to literature searches and interpretation of results. All authors revised the draft critically for important intellectual content and approved the final version. D.C.G. and V.J.B. are the guarantors of this work and, as such, had full access to all the data in the study and take responsibility for the integrity of the data and the accuracy of the data analysis.
The authors thank James Thomas, University of Leeds, for database design.
