


Obesity alters gut microbiota ecology and associates with low-grade inflammation in humans. Roux-en-Y gastric bypass (RYGB) surgery is one of the most efficient procedures for the treatment of morbid obesity resulting in drastic weight loss and improvement of metabolic and inflammatory status. We analyzed the impact of RYGB on the modifications of gut microbiota and examined links with adaptations associated with this procedure.
Gut microbiota was profiled from fecal samples by real-time quantitative PCR in 13 lean control subjects and in 30 obese individuals (with seven type 2 diabetics) explored before (M0), 3 months (M3), and 6 months (M6) after RYGB.
Four major findings are highlighted: 1) Bacteroides/Prevotella group was lower in obese subjects than in control subjects at M0 and increased at M3. It was negatively correlated with corpulence, but the correlation depended highly on caloric intake; 2) Escherichia coli species increased at M3 and inversely correlated with fat mass and leptin levels independently of changes in food intake; 3) lactic acid bacteria including Lactobacillus/Leuconostoc/Pediococcus group and Bifidobacterium genus decreased at M3; and 4) Faecalibacterium prausnitzii species was lower in subjects with diabetes and associated negatively with inflammatory markers at M0 and throughout the follow-up after surgery independently of changes in food intake.
These results suggest that components of the dominant gut microbiota rapidly adapt in a starvation-like situation induced by RYGB while the F. prausnitzii species is directly linked to the reduction in low-grade inflammation state in obesity and diabetes independently of calorie intake.
Obesity is characterized by increased fat mass accumulation and the development of comorbidities including other metabolic and cardiovascular diseases. Even though some but not all environmental factors have been elucidated, the increasing epidemic of obesity appears virtually impossible to control, and the mechanisms associated with fat mass expansion need to be identified. Obesity is considered a low-grade inflammatory disease with adipose tissue contributing to this state via the secretion of molecules capable of altering metabolic homeostasis (1,2). A novel factor identified to play a role in human obesity and associated metabolic risks is the commensal microbiota of the intestine (3).
A role for the intestinal microbiota in harvesting energy from food (4) and regulating body fat storage (5) was proposed in rodents. Germ-free mice colonized by microbiota increase their body fat and develop insulin resistance in spite of a 30% decrease in food intake. These changes were associated with a dysbiosis in obese mice: an increased representation of the Firmicutes phylum and a reduced representation of the Bacteroidetes phylum (6). Other studies suggested a contribution of the gut microbiota-produced lipopolysaccharides to inflammation and development of metabolic syndrome (7,–9). In humans, increased endotoxemia (circulating lipopolysaccharides) was found to be associated with increased fat consumption (10). In obese patients losing weight throughout low calorie diets, diminished Bacteroidetes and increased Firmicutes were found trended to that of lean control subjects at the end of the dietary intervention (11). However, modification of the Firmicutes-to-Bacteroidetes ratio observed in obese individuals was not confirmed in other studies (12). No study has clearly explored the association between these bacterial changes and improvement of metabolic or inflammatory phenotypes associated with weight modification over time.
Roux-en-Y gastric bypass (RYGB) surgery is an increasingly effective model to study in this context. RYGB leads to major improvements in metabolic and inflammatory markers (13). This procedure allows for an understanding of the molecular adaptations underlying the observed health benefits and the potential role of calorie restriction in changes in gut microbiota pattern.
Our present work analyzed the microbiota profiles in the feces of morbidly obese subjects before and after RYGB. We examined the association between gut microbiota changes and a range of body composition, metabolic, and inflammatory markers. These results provide new insight regarding gut microbiota changes in obese subjects after RYGB and highlight some bacterial groups as possible factors associated with changes in nutritional status and others with metabolic and inflammatory parameters.
RESEARCH DESIGN AND METHODS
Thirty obese subjects (27 women and 3 men) enrolled in a bariatric surgery program were recruited at the Center of Reference for Medical and Surgical Care of Obesity (Pitié-Salpêtrière Hospital, Paris, France). The patients had the criteria for obesity surgery: BMI ≥40 kg/m2 with at least two comorbidities (hypertension, type 2 diabetes, dyslipidemia, or obstructive sleep apnea syndrome). The subjects' weight was stable (± 2 kg) for at least 3 months prior to surgery. Subjects were exempted from acute or chronic inflammatory diseases, infectious diseases, viral infection, cancer, and/or known alcohol consumption. No antibiotics were taken before surgery or during the postsurgery follow-ups. Clinical and biological parameters were assessed prior to RYGB surgery (i.e., basal or M0) and at 3- and 6-months postsurgery (M3 and M6, respectively). The oral glucose tolerance test was performed in the 23 nondiabetic subjects (OB/nD subgroup). All had a glycemia <11 mmol/l 2 h after 75-g oral glucose. Seven subjects had type 2 diabetes (OB/D subgroup) with a fasting glycemia over 7 mmol/l and/or the use of an antidiabetic drug. Two individuals necessitated insulin therapy while the other five subjects were treated with metformin and hypolipidemic drugs (either fibrate or statins). Thirteen normal weight, healthy women volunteers living in the same area as the obese subjects were recruited as a lean control subject group. The Ethics Committee of the Hôtel-Dieu Hospital approved the clinical protocol. All subjects gave written informed consent.
Dietary assessment.
At each visit, caloric intake and macronutrient portions were evaluated by a registered dietitian during a 1-h questioning period. Multivitamins and iron supplements were provided to avoid deficiencies, a well-known secondary effect of bariatric surgery (14). Serum iron, ferritin, the coefficient of saturation of iron in transferrin, vitamins (A, D, E, B1, B12, and B9), micronutrients, and calcium were measured using routine bio-clinical tests. Serum analyses showed that these parameters were in the normal range at all time points (data not shown).
Body composition, metabolic, and inflammatory parameters.
Body composition was determined before and after the surgery by dual-energy X-ray absorptiometry (GE Lunar Prodigy Corporation, Madison, WI), and resting energy expenditure was measured by indirect calorimetry (Deltatrac, Datex, France). Periumbilical surgical biopsies of subcutaneous adipose tissues were obtained and adipocyte diameter was measured as described (15). Blood samples were obtained at each time point after 12-h fasting to measure plasma lipids (total cholesterol, HDL cholesterol, and triglycerides), insulin, glucose, leptin, adiponectin, and inflammatory markers (high-sensitivity C-reactive protein [hs-CRP], interleukin [IL]-6, orosomucoid).
Fecal samples.
Fecal samples were obtained in the morning before breakfast. Whole stools were self-collected in sterile boxes and stored at −20°C within 4 h. Samples were treated in the laboratory as 200-mg aliquots and stored at −80°C until further analysis. The 30 obese subjects and 13 healthy control subjects delivered samples at M0. During follow-ups, fecal samples were obtained for 26 subjects (including 6 diabetic subjects) at M3 and for 15 subjects (including 5 diabetic subjects) at M6. A complete course of stool samples (M0, M3, and M6) was finally obtained for 10 individuals.
DNA extraction from fecal samples.
DNA was extracted from (200-mg aliquots) feces as previously described (16). After the final precipitation, DNA was resuspended in 150 ml of TE buffer and stored at −20°C prior to further analysis.
Oligonucleotide primers and probes.
The primers and probes used in this study are presented in supplementary Table 6, available in an online appendix at http://diabetes.diabetesjournals.org/cgi/content/full/db10-0253/DC1. TaqMan qPCR was adapted to quantify the total bacteria population in addition to the dominant (>1% of fecal bacteria) bacterial species Clostridium leptum (C. leptum), Clostridium coccoides (C. coccoides), Bacteroides/Prevotella, and Bifidobacterium. Real-time qPCR using SYBR Green was performed for the Lactobacillus/Leuconostoc/Pediococcus and for the subdominant bacterial species Escherichia coli (E. coli), as well as for the Faecalibacterium prausnitzii (F. prausnitzii). The TaqMan probes were synthesized by Applied Biosystems Applera-France (Courtaboeuf, France). Primers were purchased from MWG (MWG-Biotech AG, Ebersberg, Germany).
Real-time qPCR.
Real-time qPCR was performed using an ABI 7000 Sequence Detection System with software version 1.2.3 (Applied Biosystems, Foster City, CA). Amplification and detection were carried out in 96-well plates with TaqMan Universal PCR 2× MasterMix (Applied Biosystems) or with SYBR Green PCR 2× Master Mix (Applied Biosystems). Each reaction was run in duplicate in a final volume of 25 ml with 0.2 mmol/l final concentration of each primer, 0.25 mmol/l final concentration of each probe, and 10 μl of appropriately diluted DNA samples. Amplifications were carried out using the following ramping profile: one cycle at 95°C for 10 min, followed by 40 cycles of 95°C for 30 s, 60°C for 1 min. For SYBR Green amplifications, a melting step was added to improve amplification specificity. The total numbers of bacteria were inferred from averaged standard curves as described (17).
Normalization of qPCR data.
All bacteria results were presented as the mean of the log10 value ± SEM. To recount for water content in fecal samples, data for each fecal sample was normalized as previously described (16). The level for each bacterial species or group was subtracted from all bacteria content. The data are presented as log number of bacteria per gram of stool.
Day-to-day variations.
To evaluate the stability of results of microbiota, we added a supplementary experiment to estimate day-to-day variations of fecal samples. Five healthy lean women (BMI: 23 ± 1; age 28 years ± 0.3) were included in this study. Fecal samples were collected during two consecutive days in the same conditions and with the same method of collection and treatment as cited above (supplementary Table 5).
Biochemical assays.
Plasma glucose was measured by the glucose oxidase method (Beckman Fullerton, Palo Alto, CA). Plasma insulin was determined by using the reactive kit from Abbott (Rungis, France). Plasma triglycerides and free fatty acids were measured with Biomérieux kits (Marcy l'Etoile, France), and total cholesterol, HDL cholesterol, and LDL cholesterol with Labintest kits (Aix-en-Provence, France). Leptin, adiponectin, hs-CRP, IL-6, and TNF-α were determined by using ELISA kits from R&D Systems (Minneapolis, MN).
Statistical analysis.
All values are expressed as mean ± SEM. Homeostasis model assessment of insulin resistance (HOMA-IR), insulin sensitivity (HOMA-S%), and β-cell function (HOMA-B%) provided in supplementary Table 2 were estimated. The composition of microbiota is expressed as mean of the log10 of the normalized PCR values. Wilcoxon rank sum tests were used to assess statistical significance of differences between lean control subjects and OB/nD and OB/D subjects at baseline. Paired Wilcoxon tests were performed to analyze changes in these parameters between various time points after surgery.
Principal component analysis (PCA) combined with co-inertia analysis was used to explore complex and potentially redundant relationships involving a relatively large number of clinical, biological, and microbiological variables at baseline and following RYGB. Co-inertia analysis is a coupling method for comparing different types of parameters presenting different variances. The significances of the associated variations of biological and clinical parameters and of bacterial counts during the follow-up after surgery were evaluated by Monte Carlo tests. Significant associations were visualized by a circle of correlations while their intensity was expressed by computing Spearman correlation coefficients (Rs).
The significances of the strongest dynamic associations of clinical-biological parameters and of bacterial counts after surgery among those identified by PCA and co-inertia analysis were further evaluated by building linear mixed-effects (LME) models to test for inter-variable redundancies and to adjust for potential confounding factors. All LME models were fit by maximizing the restricted log-likelihood (REML) of their estimated coefficients. All statistical analyses were performed using the R software (http://www.r-project.org). PCA and co-inertia analyses were performed with ADE-4 package (18). LME modeling was performed by relying on statistical functions available in the nlme package (19). All statistical computations were considered significant when resulting P values were <0.05 threshold.
RESULTS
Clinical and biological characteristics before RYGB.
The clinical characteristics of lean and OB/D or OB/nD subjects are presented in supplemental Table 1. While mean age between control subjects and OB/nD subjects were not statistically different, OB/D subjects were older.
RYGB improves markedly clinical, metabolic, and inflammatory phenotypes.
Along with the drastic reduction in food consumption, RYGB resulted in significant changes in body weight and fat mass from M0 to M3 and M6 (Table 1). For the majority of parameters, improvements occurred rapidly in the first 3 months. At M6, the subjects had lost 22% of their initial weight (P < 0.01). Fat mass decreased and the percentage of fat-free mass increased. These changes were associated with a decrease in adipocyte cell diameter (P < 0.05) and leptin serum concentrations (P < 0.01). These improvements were observed in both groups (OB/nD and OB/D) when considered separately (supplementary Table 2). However, the improvements found in inflammatory parameters (hs-CRP, orosomucoid) in the whole group of obese subjects (Table 1) disappeared when considered separately (supplementary Table 2). A slight decrease in orosomucoid remained in the OB/nD group.
Clinical and biological characteristics of obese subjects before, and 3 and 6 months after gastric surgery
| After bypass | |||
|---|---|---|---|
| Before bypass | 3 months | 6 months | |
| Food intake | |||
| Food intake (kcal) | 1,933 ± 101A | 1,080 ± 87B | 1,355 ± 54C |
| Adiposity markers | |||
| Body weight (kg) | 126 ± 4.2A | 107 ± 3.9B | 98 ± 3.8C |
| BMI (kg/m2) | 47.6 ± 1.5A | 40.6 ± 1.3B | 37.1 ± 1.3C |
| Adipocyte diameter (μm) | 116.7 ± 1.5A | 110.7 ± 1.0B | 103.3 ± 3.2C |
| REE (kcal) | 1,814.4 ± 54.8A | 1,842.5 ± 53.6A | 1,551.1 ± 42.9B |
| Fat mass % | 47.9 ± 1.0A | 44.5 ± 1.0B | 41.3 ± 1.2C |
| Fat-free mass % | 50.0 ± 1.0A | 53.0 ± 0.9B | 55.9 ± 1.1C |
| Leptin (ng/ml) | 50.8 ± 3.7A | 25.6 ± 2.5B | 24.9 ± 2.8B |
| Plasma glucose homeostasis and insulin sensitivity | |||
| Glycemia (mmol/l) | 6.4 ± 0.5A | 5.1 ± 0.2B | 4.8 ± 0.1B |
| A1C (%) | 6.4 ± 0.3A | 5.7 ± 0.1B | 5.8 ± 0.1B |
| Insulinemia (μU/ml) | 17.1 ± 1.6A | 10.7 ± 0.9B | 6.9 ± 0.7C |
| HOMA-IR | 0.88 ± 0.09A | 0.63 ± 0.03B | 0.78 ± 0.09A |
| Adiponectin (μg/ml) | 6.4 ± 0.5A | 7.8 ± 0.7A | 8.3 ± 0.7B |
| Plasma lipid homeostasis | |||
| Total cholesterol (mmol/l) | 4.54 ± 0.16A | 4.23 ± 0.16A | 4.34 ± 0.15A |
| Triglycerides (mmol/l) | 1.57 ± 0.19A | 1.54 ± 0.17A | 1.48 ± 0.17A |
| HDL cholesterol (mmol/l) | 1.22 ± 0.05A | 1.17 ± 0.06A | 1.30 ± 0.06B |
| Inflammatory markers | |||
| Plasma hs-CRP (mg/dl) | 3.1 ± 0.8A | 2.5 ± 0.9B | 2.7 ± 0.8B |
| Plasma IL-6 (pg/ml) | 4.4 ± 0.4A | 4.2 ± 0.4A | 3.4 ± 0.4A |
| Plasma orosomucoid (g/l) | 1.02 ± 0.04A,B | 0.94 ± 0.04A | 0.86 ± 0.03B |
Values are expressed as mean ± SE (n = 30). Fat mass %, fat-free mass %: values expressed as a percentage of body weight. Paired Wilcoxon stands for analyzing parameters changes between various time points. Data not sharing the same letter within a horizontal line are significantly different (P < 0.05). REE: resting energy expenditure.
Plasma glucose, insulin levels, glycosylated hemoglobin (A1C) and HOMA-IR decreased significantly post-RYGB, however adiponectin concentration did not change significantly at M3 (Table 1). An improvement in insulin sensitivity (HOMA-S%) of the OB/nD group and an amelioration of blood glucose homeostasis were found in the seven diabetic subjects (supplementary Table 2). Antidiabetic drugs were stopped in diabetic subjects as well as hypolipidemic treatment in all obese individuals.
Basal bacterial groups counts: decreased amount of Bacteroides/Prevotella in obesity and of F. prausnitzii in diabetes.
Average counts for each bacterial group of control, OB/nD, and OB/D subjects are presented in Table 2 and Fig. 1. The Bacteroides/Prevotella group was lower in obese subjects (OB/nD: P = 0.039 and OB/D: P = 0.038) compared with lean subjects. However, while the population of C. leptum tended to be lower in obese subjects, the differences did not reach statistical significance probably due to the high interindividual variability in this bacterial population subgroup. F. prausnitzii species qPCR system could reliably distinguish between the control and OB/D microbiota. Their counts in the OB/D microbiota were significantly lower when compared with those of the control group (P < 0.01) and OB/nD subjects (P < 0.05). These results suggest that while obesity leads to modification in the Bacteroides/Prevotella group, diabetes seems to influence the abundance of F. prausnitzii (supplementary Fig. 1).
Composition of microbiota compared in lean control subjects, obese diabetic (OB/D) subjects, and nondiabetic (OB/nD) subjects before gastric surgery
| n | All bacteria* | Firmicutes | Faecalibacterium prausnitzii species†‡ | Bacteroidetes | |||||
|---|---|---|---|---|---|---|---|---|---|
| Clostridium Coccoides group† | Lactobacillus/Leuconostoc/Pediococcus group† | Clostridium leptum group† | Bifidobacterium genus† | Bacteroides/Prevotella group† | E. coli species† | ||||
| Control subject | 13 | 11.74 ± 0.1 | −1.58 ± 0.1A | −3.46 ± 0.2A | −0.31 ± 0.1A | −1.06 ± 0.2A | −2.47 ± 0.4A | −1.11 ± 0.1A | −3.43 ± 0.3A |
| OB/nD | 23 | 11.29 ± 0.1 | −1.58 ± 0.2A | −2.75 ± 0.3A | −0.86 ± 0.3A | −1.45 ± 0.2A | −2.37 ± 0.2A | −1.61 ± 0.1B | −3.42 ± 0.3A |
| OB/D | 7 | 11.17 ± 0.1 | −1.46 ± 0.4A | −2.62 ± 0.5A | −1.63 ± 0.8A | −2.79 ± 0.5B | −2.22 ± 0.4A | −1.61 ± 0.2B | −2.49 ± 0.3A |
Data not sharing the same letter within a column are significantly different (P < 0.05). n: represents the numbers of studied samples.
*All bacteria results obtained by qPCR were expressed as mean of the log10 value ± SE.
†Results were expressed as mean of the log10 value ± SE of normalized data, calculated as the log number of targeted bacteria minus the log number of all bacteria.
‡Faecalibacterium prausnitzii is the major component of the Clostridium leptum group.
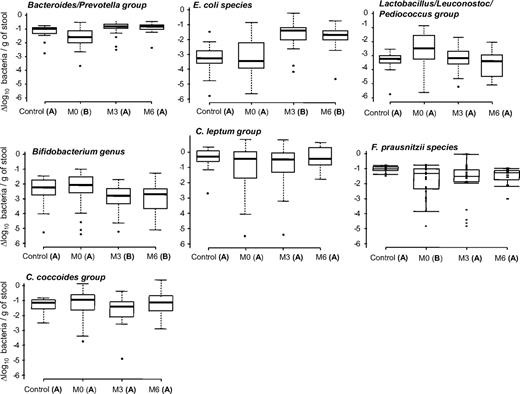
Quantifications of fecal microbiota in lean control subjects and obese subjects before (M0) and after surgery (M3 and M6). The qPCR results were plotted as boxes and whiskers graph. The boxes (containing 50% of all values) show the median (horizontal line across the middle of the box) and interquartile range, while the whiskers represent the 10th and 90th percentiles. The extreme data points are indicated as circles. Data not sharing the same letter in parentheses within a horizontal line are significantly different (P < 0.05).
Quantifications of fecal microbiota in lean control subjects and obese subjects before (M0) and after surgery (M3 and M6). The qPCR results were plotted as boxes and whiskers graph. The boxes (containing 50% of all values) show the median (horizontal line across the middle of the box) and interquartile range, while the whiskers represent the 10th and 90th percentiles. The extreme data points are indicated as circles. Data not sharing the same letter in parentheses within a horizontal line are significantly different (P < 0.05).
Bacterial changes after RYGB: increased amount of Bacteroides/Prevotella and E. coli, decreased Bifidobacterium and Lactobacillus/Leuconostoc/Pediococcus groups.
Changes of bacteria amounts were observed in the obese group (OB/nD and OB/D together) after surgery but with a different pattern depending on the bacterial group (Fig. 1). Supplementary Table 3 illustrates the progression of all bacterial populations within the microbiota before (M0) and after RYGB (M3 and M6) in each obese group and separated by the diabetic status. In the OB/D subjects, a similar pattern of changes as the one characterizing the OB/nD subjects was observed, but changes for certain bacterial groups did not reach statistical significance. The Bacteroides/Prevotella population, whose level was lower in obese subjects before RYGB, increased at M3 and remained stable until M6 (Fig. 1) at a level close to that of the control subjects. Importantly, the obese subjects remained obese at M6 (BMI 37.1 ± 1.3 vs. 21.1 ± 0.4, obese and lean subjects, respectively). At M3, E. coli showed a rapid and significant increase reaching a level higher than that of the control subjects. An opposite pattern was observed for both the Bifidobacterium and Lactobacillus/Leuconostoc/Pediococcus groups. Levels of both populations decreased at M3 and M6 and reached, in the case of Bifidobacterium, a level lower than that measured in the control subjects.
Interestingly, the level of F. prausnitzii, which was lower in OB/D subjects before RYGB, increased at M3 and remained stable at M6 (supplementary Table 3). The populations of Clostridium (C. leptum and C. coccoides) were stable post-RYGB.
Association between microbiota composition and clinical phenotypes before RYGB.
In OB/nD and OB/D subjects, we observed significant relationships between the amount of F. prausnitzii, E. coli, and Bacteroides/Prevotella and metabolic and inflammatory parameters (supplementary Table 4A). The strongest associations were found for the amount of F. prausnitzii, which was negatively correlated with serum concentrations of inflammatory circulating markers (hs-CRP Rs −0.54, P < 0.01 and IL-6 Rs −0.65, P < 0.001). This negative correlation was consistently significant when analyzed alone in the OB/nD subjects. No significant association was correlated with age for any analysis.
Time-dependant associations between metabolic phenotypes and bacterial populations.
Statistical LME models were used to distinguish within-subject from between-subject sources of variation and to describe how trajectories in clinical and bacterial population mean responses showed related changes over time. Analyses firstly included the entire population of obese subjects regardless of their diabetic status, and secondly in the OB/nD group or the OB/D group alone. The corpulence parameters, including body weight, BMI, body fat mass, and serum leptin concentrations, were correlated negatively with the counts of Bacteroides/Prevotella and E. coli, while positively with the amounts of Bifidobacterium population, independent of the diabetic states.
In the OB/nD group, Bacteroides/Prevotella counts correlated negatively with calorie intake (P < 0.01), which drastically changed after the bypass (supplementary Table 4B). Analysis, performed in the OB/nD group and associating calorie intake and each of the adiposity-related parameters as fixed-effects in a combined LME model, confirmed the negative relationship between Bacteroides/Prevotella counts and the decrease in food consumption post-RYGB (P < 0.05). This result was independent of corpulence. The combined model could not demonstrate significant independent relationships with any of the adiposity-related parameters, thus indicating that variations in Bacteroides/Prevotella population after surgery are related mostly to calorie intake in this cohort.
Unlike the Bacteroides/Prevotella population, the relationship between calorie intake and E. coli counts lost statistical significance in the combined model. This suggests that E. coli could be considered as a marker of corpulence variation after surgery, independent of energy intake. The relationships between the microbiota and these clinical parameters, explored through PCA, is illustrated in Fig. 2,A, which displays the strong negative correlation between E. coli counts and leptin serum concentration (Rs −0.53, P < 0.001). This correlation is reinforced in Fig. 2 B, which concomitantly illustrates the kinetic evolution between E. coli population and leptin as a mirror image.
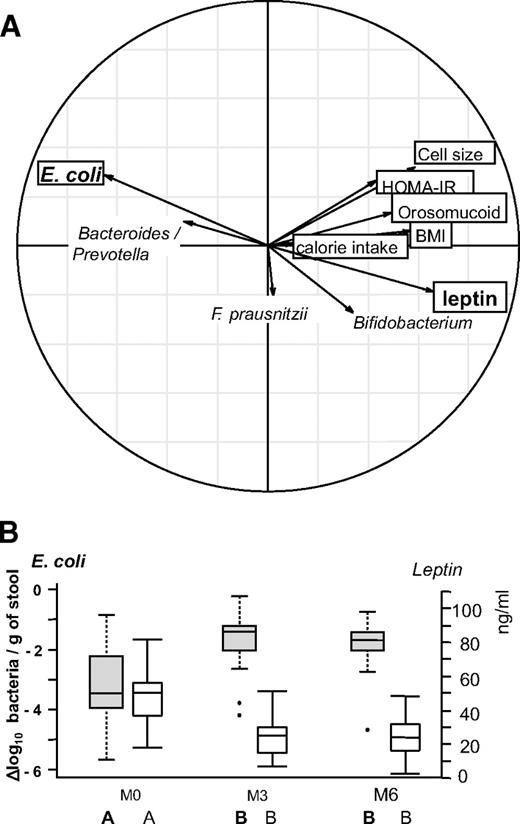
Relationship between changes in fecal microbiota composition and clinical parameters in obese patients following RYGB surgery. Real-time qPCR quantifications were used to determine the fecal microbiota composition for the bacterial groups indicated in supplementary Table 6. Clinical parameters included adipocyte cell size, BMI, calorie intake, HOMA-IR, leptin, and orosomucoid. A: Principal component analysis (between class analyses). Bold arrows indicate the marked inverse relationship between changes in E. coli population and leptin serum concentrations. B: Dynamics of E. coli population evolution and leptin concentration during the study. E. coli population levels are expressed as mean ± SEM of the Δlog10 value of normalized data calculated as the log number of targeted bacteria minus the log number of all bacteria. Leptin results were expressed as mean ± SEM of serum concentrations.
Relationship between changes in fecal microbiota composition and clinical parameters in obese patients following RYGB surgery. Real-time qPCR quantifications were used to determine the fecal microbiota composition for the bacterial groups indicated in supplementary Table 6. Clinical parameters included adipocyte cell size, BMI, calorie intake, HOMA-IR, leptin, and orosomucoid. A: Principal component analysis (between class analyses). Bold arrows indicate the marked inverse relationship between changes in E. coli population and leptin serum concentrations. B: Dynamics of E. coli population evolution and leptin concentration during the study. E. coli population levels are expressed as mean ± SEM of the Δlog10 value of normalized data calculated as the log number of targeted bacteria minus the log number of all bacteria. Leptin results were expressed as mean ± SEM of serum concentrations.
Time-dependant associations between inflammatory parameters and changes in bacterial populations: importance of F. prausnitzii.
F. prausnitzii showed a consistent correlation with low-grade inflammation. After the surgery, the circulating inflammatory parameters (hs-CRP, IL-6, and orosomucoid) were reduced and an association was found with an increase in F. prausnitzii. F. prausnitzii variation was strongly and negatively correlated with changes in hs-CRP, IL-6, and orosomucoid serum levels when nondiabetic and diabetic obese subjects were grouped together. The correlations with hs-CRP and IL-6 were maintained in the OB/nD group (supplementary Table 4B). These relationships were independent of calorie intake.
DISCUSSION
Analysis of the dynamic changes post-RYGB provided important information regarding potential associations between gut microbiota composition, food intake, metabolic adaptations, and inflammation. In spite of the relatively sample size of the diabetic group and some incompletion in the collection of fecal samples, this study compared not only the different profile of gut microbiota between lean and obese diabetic or nondiabetic subjects, but revealed for the first time that changes of gut microbiota in the same individual before and after RYGB associate with a series of phenotypes. While some gut bacteria groups correlated with energy intake, body corpulence, and metabolic changes, others, such as F. prausnitzii, associated with changes in the inflammatory state and diabetes.
Our observation was made in severely obese subjects and might not be extended to moderately obese subjects. However, the lower proportion of Bacteroides/Prevotella in obese subjects before RYGB and their increase after weight loss are in agreement with landmark studies in less obese populations (11,20). Correlation studies in LME kinetic models provide important information showing that these populations of bacteria were strongly associated with body composition and metabolic parameters. After RYGB, the higher the increase in the proportions of Bacteroides/Prevotella, the better the reduction in body fat mass and plasma leptin. These associations were dependent on energy intake. The estimated Firmicutes-to-Bacteroidetes ratio diminished substantially during weight loss, an observation also made in our study mostly due to the increase in Bacteroides/Prevotella. A degree of controversy was raised with regard to this result. No changes in the proportion of Bacteroidetes or Firmicutes-to-Bacteroidetes ratio were found, while the total numbers of bacteria decreased in other studies (12,21). These discrepancies could be attributed to substantial differences in clinical protocols with varying levels and duration of calorie restriction and fat mass loss. RYGB could be considered as a unique model that can be clinically followed over time in the same individual. RYGB was found to be associated with a decrease in Firmicutes together with an increase in γ-Proteobacteria in three adults (22). In this first study, the individual fecal samples before and after weight loss were not paired, and no information was provided about the amount weight lost and associated phenotypic changes.
Here our patients were followed for 6 months with a marked reduction in food intake at M3 and M6 post-RYGB. It is important to note that there is a well-known uncertainty and possible underestimation of food intake in obese subjects (23). Nevertheless, after a short fasting period (1–3 days), the subjects started to increase their food intake that was composed of liquid or semi-liquid foods for 1 week. During the 3 months after RYGB, starch-based foods are often the principal food items with solid foods being progressively reintroduced. With reduced calorie intake and changes in body composition, leptin dropped and its variations were negatively associated with the amount of Bacteroides/Prevotella and E. coli, while positively associated with Bifidobacterium and Lactobacillus/Leuconostoc/Pediococcus. Among its diverse physiological functions, the major adipocyte-secreted hormone, leptin, has a critical role in the initiation of adaptation responses to starvation (24). In the present study, leptin levels fell rapidly with the onset of energy deprivation at M3 (−50% of basal values) and relatively stabilized at M6 while BMI, fat mass, and adipocyte sizes continued to shrink, which is in line with the results found in other studies (25). This phenomenon is recognized as signaling the shift between sufficient and insufficient body energy. The ability of sustained fasting to induce dissociation between circulating leptin levels and adipose tissue mass could also reflect a permissive effect of insulin on leptin secretion. This may have conferred a survival advantage during evolution as leptin stimulates energy expenditure and inhibits appetite (26). In agreement with Bajzer and Seeley (27), changes in gut microbiota post-RYGB could be linked to maximizing energy harvest as a host adaptation to the starvation-like condition. The fact that for most gut bacteria, changes were observed at M3 and remained stable at M6 (supplementary Table 3) while corpulence and metabolic factors continued to improve favors this particular interpretation. This is also strengthened by the results of another study (L.-C. Kong, S. Rizkalla, K. Clément, et al.) from our laboratory that demonstrates early changes in fecal bacteria population, which started 1 week after caloric restriction. Interestingly, compared with germ-free animals, hepatic ketogenesis is enhanced during 24-h fasting in mice (CONV-D) after a microbiota transplant from the distal gut of conventionally raised lean counterparts fed with carbohydrates (28). The CONV-D mice showed an increase of short-chain fatty acids, and the proportion of Bacteroidetes switched from 20.6% at the fed state to 42.3% at the fasted state, while the proportion of Firmicutes reduced from 77.1 to 52.6%. We also found that the relationship between some gut microbiota changes and corpulence and metabolic parameters might not be statistically dependent on dietary changes as in the case of E. coli and Bifidobacterium. This is an indirect indication that microbiota components could participate in metabolic changes associated with this surgical procedure.
RYGB procedure per se may contribute to changes in gut microbiota composition. RYGB creates a small gastric pouch and the distal stomach and proximal small intestine are bypassed by attaching the distal end of the mid-jejunum to the proximal gastric pouch. The bile and pancreatic limb is attached along the Roux limb. Gastric acidity is bypassed leading to a reduction of chloride acid flux in the gut. Patients were also under the proton pump inhibitor therapy during the first 3 months, which can also influence the gastric pH. The resulting increased pH, together with the downstream delivery of bile acids, could contribute to modify fecal bacteria population. In in vitro culture studies, the growth of Bacteroidetes was found to be inhibited when reducing pH, while the growth of E. coli was facilitated by increased pH (29). We did not measure the pH in our subjects' fecal samples, but the decreased acidity in the gut after RYGB could favor an increase in Bacteroides/Prevotella and E. coli counts. The changes in E. coli strongly correlated negatively with leptin variation (Fig. 2 A). However, leptin can also be secreted by cells in the lower half of the stomach glands (30). The signaling molecules mechanistically involved in driving these links need to be elucidated. Another consequence of pH change post-RYGB could be the decrease in Lactobacillus/Leuconostoc/Pediococcus and Bifidobacterium (31). This is not consistent with the studies in mice that suggest a beneficial effect of Bifidobacterium species in the improvement of obesity-related metabolic and inflammatory condition (8). The Bifidobacterium genus, however, is complex. In adolescents losing moderate amounts of weight, the counts of B. bifidum and of B. breve diminished while B. catenulatum increased (32). Information on the intake of prebiotic or probiotic are not available in this study; hence, we cannot exclude a possible influence of functional ingredients included in foods (e.g., yogurts) on these bacteria.
Shorter- and longer-term studies are needed to explore the dynamics of subjects undergoing bypass surgery with attention given to food intake behavior, measures of metabolic mediators (such as short-chain fatty acids and free fatty acids), measures of fecal pH to explore the dependency between changes in food intake, the influence of the surgery per se, and gut bacterial groups. A comparison with patients only subjected to a restrictive surgical procedure (i.e., gastroplasty) would be useful in this respect.
The other important information provided here was that F. prausnitzii was associated with inflammatory markers. F. prausnitzii has been identified as a conserved and dominant species of the human fecal microbiota of healthy individuals (33). F. prausnitzii might play a role in preventing local bowel inflammation and infection in acute inflammatory disease. A reduction of F. prausnitzii has been described in inflammatory bowel disease and in infectious colitis (34). Our study suggests that F. prausnitzii could also play a role in low-grade inflammation pathologies like obesity and diabetes (35,–37). The relationship between F. prausnitzii and inflammatory markers was observed both in OB/nD and OB/D patients and remained after adjustment for BMI. The proportions of F. prausnitzii were lower in type 2 diabetic subjects displaying a worsening of their low-grade inflammation (38) and higher insulin resistance. A negative association was also seen between F. prausnitzii and HOMA-IR, which could be explained by the amelioration of glucose metabolism in the diabetic group. However in the present study, this was not true for adiponectin, another marker of insulin sensitivity. The discrepancy between HOMA-IR and adiponectin during weight loss has been well documented (39).
F. prausnitzii population variation was associated with modulation of urinary metabolites of diverse structure indicating that this species is a highly active member of the microbiome, influencing host pathways (40). F. prausnitzii exhibits anti-inflammatory effects, partly due to secreted metabolites able to block nuclear factor-κB activation and the secretion of proinflammatory mediators (41). Oral administration of F. prausnitzii or of supernatant from F. prausnitzii cultures increased the production of IL-10 by blood mononuclear cells and reduced the production of the proinflammatory mediator-like IL-12 in the colon. The modulation of nuclear factor-κB by pharmacological agents such as statins or salicylates has been proposed as a tool to improve insulin sensitivity in type 2 diabetic patients (42,43). Our study raises the question regarding the role of F. prausnitzii as a mediator of low-grade inflammation in obesity and diabetes and open avenues for future investigation exploring its contribution to insulin resistance.
Because of an increasing interest in treating type 2 diabetes with gastric bypass surgery, the improvement of insulin sensitivity and the reduction of diabetes in subjects postsurgery has become a primary axis of interest (44). Unraveling the immediate and long-term adaptations associated with gastric bypass surgery has proved challenging predominantly because the consequences of this procedure include caloric restriction, diminished nutrient absorption, reduced adipose mass, modified gut hormone signaling, and changes in whole-body glucose metabolism, which can each cause numerous physiological and metabolic adaptations (45,46). Hypotheses have been postulated to explain the improved insulin sensitivity witnessed postsurgery and include the altered secretion of gut hormones (47,48), modifications in intestinal gluconeogenesis (49), and changes in intramyocellular lipid content (50). While the definitive explanation for improved insulin sensitivity post-RYGB remains unclear, it is most probably a combination of the aforementioned hypotheses. Components of gut microbiota and possibly the relationship between gut hormones and F. prausnitzii should also be considered in this context. Taken together, the applicability of F. prausnitzii as a valuable therapeutic tool for the improvement of inflammation, blood glucose tolerance, and insulin sensitivity, calls for more investigations.
Clinical trial reg. no. NCT0047658, www.clinicaltrials.gov.
The costs of publication of this article were defrayed in part by the payment of page charges. This article must therefore be hereby marked “advertisement” in accordance with 18 U.S.C. Section 1734 solely to indicate this fact.
ACKNOWLEDGMENTS
This work was funded in part by the French National Agency for Research under project MicroObes (ANR-o7-GMGE-002.1-01). L.-C.K. received support from Danone (France), and C.H. received support from sanofi-aventis/French Association for the Research on Obesity. No other potential conflicts of interest relevant to this article were reported.
J.-P.F. researched data, contributed to the discussion, wrote the manuscript, and reviewed/edited the manuscript. L.-C.K. researched data, contributed to the discussion, wrote the manuscript, and reviewed/edited the manuscript. J.T. researched data, contributed to the discussion, and reviewed/edited the manuscript. C.P. researched data and reviewed/edited the manuscript. A.B. researched data and reviewed/edited the manuscript. J.-L.B. researched data and reviewed/edited the manuscript. D.M. researched data. G.C. researched data, contributed to the discussion, and reviewed/edited the manuscript. J.D. contributed to the discussion and reviewed/edited the manuscript. C.H. contributed to the discussion and reviewed/edited the manuscript. S.R. researched data, contributed to the discussion, wrote the manuscript, and reviewed/edited the manuscript. K.C. researched data, contributed to the discussion, wrote the manuscript, and reviewed/edited the manuscript.
Parts of this study were presented at the 70th Scientific Sessions of the American Diabetes Association, Orlando, Florida, 25–29 June 2010.
We appreciate the support from the Assistance Publique-Hôpitaux de Paris and the Department of Clinical Research, which promoted and supported the clinical investigation (CRIC NCT 0047658). We thank Christine Baudouin, Dr. Florence Marchelli, and Patricia Ancel (Center of Research on Human Nutrition, Pitié-Salpêtrière Hospital, Paris, France) who were involved in patient recruitment, data collection, and sampling at the Center of Research on Human Nutrition, Pitié-Salpêtrière Hospital. We thank Dr. Sean P. Kennedy (Unit of Digestive System Ecology and Physiology, French National Institute for Agricultural Research, Jouy-en-Josas, France) for the critical reading of the manuscript.
