


Abstract
Pancreatic ductal adenocarcinoma (PDAC) is a deadly disease characterized by an extensive fibroinflammatory stroma, which includes abundant cancer-associated fibroblast (CAF) populations. PDAC CAFs are heterogeneous, but the nature of this heterogeneity is incompletely understood. The Hedgehog pathway functions in PDAC in a paracrine manner, with ligands secreted by cancer cells signaling to stromal cells in the microenvironment. Previous reports investigating the role of Hedgehog signaling in PDAC have been contradictory, with Hedgehog signaling alternately proposed to promote or restrict tumor growth. In light of the newly discovered CAF heterogeneity, we investigated how Hedgehog pathway inhibition reprograms the PDAC microenvironment.
We used a combination of pharmacologic inhibition, gain- and loss-of-function genetic experiments, cytometry by time-of-flight, and single-cell RNA sequencing to study the roles of Hedgehog signaling in PDAC.
We found that Hedgehog signaling is uniquely activated in fibroblasts and differentially elevated in myofibroblastic CAFs (myCAF) compared with inflammatory CAFs (iCAF). Sonic Hedgehog overexpression promotes tumor growth, while Hedgehog pathway inhibition with the smoothened antagonist, LDE225, impairs tumor growth. Furthermore, Hedgehog pathway inhibition reduces myCAF numbers and increases iCAF numbers, which correlates with a decrease in cytotoxic T cells and an expansion in regulatory T cells, consistent with increased immunosuppression.
Hedgehog pathway inhibition alters fibroblast composition and immune infiltration in the pancreatic cancer microenvironment.
A better understanding of the roles of signaling pathways differentially activated in distinct fibroblast populations will shed light on the complexity of fibroblast heterogeneity in pancreatic cancer. Here, we show that Hedgehog pathway inhibition alters fibroblast composition toward a more inflammatory microenvironment, opening the possibility for future combination therapies.
Introduction
Pancreatic ductal adenocarcinoma (PDAC) is a lethal malignancy with a 5-year survival rate of approximately 10% (1). The PDAC microenvironment is characterized by an extensive stroma, comprised of nonneoplastic cells and extracellular matrix (ECM) components, including cancer-associated fibroblasts (CAF). Within the stroma, CAFs secrete growth factors, immunomodulatory ligands, and ECM proteins (2–4). The Hedgehog signaling pathway is activated in PDAC CAFs and has been associated with ECM deposition and pancreatic tumorigenesis (5–10). In PDAC, Hedgehog signaling acts via a paracrine mechanism, whereby tumor-derived Hedgehog ligands activate downstream signaling in CAFs through interactions with the canonical Hedgehog receptor, patched (PTCH1), and the coreceptors, GAS1, CDON, and BOC (11–15). These interactions initiate a downstream signaling cascade mediated by smoothened (SMO), which results in cellular responses driven by GLI proteins, the transcriptional effectors of the Hedgehog pathway (16). However, reports investigating the role of Hedgehog signaling in pancreatic cancer progression have been contradictory. Initial studies indicated that Hedgehog pathway inhibition in transplantation models impairs PDAC growth (5, 6, 12, 17, 18). Moreover, acute Hedgehog pathway inhibition in a genetically engineered mouse model (GEMM) of PDAC depleted the ECM, increased vascular perfusion, and sensitized tumors to chemotherapy, providing a modest survival advantage (19). However, these findings failed to translate in clinical trials, which were largely unsuccessful or even detrimental to patient health, leading to early termination (20, 21). Subsequently, genetic inactivation of the ligand Sonic Hedgehog (SHH) in the context of an oncogenic Kras-driven mouse model of pancreatic cancer led to cachexia and to poorly differentiated and highly vascularized tumors, findings that were at least in part recapitulated by prolonged pharmacologic Hedgehog pathway inhibition (22, 23). These disparate outcomes, with Hedgehog signaling seemingly both promoting and restricting pancreatic cancer progression, indicate potentially pleiotropic roles for this pathway that have yet to be fully elucidated.
The healthy pancreas is home to distinct fibroblast populations (24, 25), which have differing potential to expand during carcinogenesis (26). We and others recently demonstrated that PDAC CAFs are also a heterogeneous population comprised of myofibroblastic CAFs (myCAF), inflammatory CAFs (iCAF), and antigen-presenting CAFs (apCAF; refs. 24, 25, 27–30). Given the different functional roles proposed for these CAF subtypes, changes in the ratio of these populations may lead to distinct outcomes in PDAC progression. Therefore, we investigated whether Hedgehog modulation differentially affects PDAC CAF subtypes. Here, we show that Hedgehog pathway activation is higher in myCAFs compared with iCAFs in both mouse and human PDAC. Our data suggest that driving higher levels of Hedgehog signaling promotes pancreatic tumor growth, whereas acute inhibition of Hedgehog signaling reduces tumor volume. This study also defines a novel dosage-dependent role for the Indian Hedgehog (IHH) ligand in pancreatic cancer. Our data collectively support the notions that Hedgehog signaling is a key pathway in the maintenance of the myCAF subtype in pancreatic cancer, and that Hedgehog pathway inhibition alters the ratio of myCAF/iCAF populations in PDAC and shifts the inflammatory response toward a more immunosuppressive microenvironment.
Materials and Methods
Study approvals
All animal procedures and studies were conducted in compliance with the guidelines of the Institutional Animal Care and Use Committee at the University of Michigan (Ann Arbor, MI, protocol number, PRO00007983) and at Cold Spring Harbor Laboratory (Cold Spring Harbor, NY).
All procedures performed in studies involving human participants were in accordance with the ethical standards of the institutional research committee at which the studies were conducted and with the 1964 Helsinki Declaration and its later amendments or comparable ethical standards. All human organoid experiments were approved by the Institutional Review Board of (IRB) Cold Spring Harbor Laboratory (Cold Spring Harbor, NY) and conducted in accordance with recognized ethical guidelines (Declaration of Helsinki). Surgical specimens of either tumor tissue or adjacent/normal pancreas were obtained from patients referred for the Whipple procedure or distal pancreatectomy according to IRB HUM00025339. Informed written consent was obtained from each subject.
Animal experiments
Orthotopic transplantation models
C57BL/6J (BL/6J) mice (stock number 000664) were purchased from The Jackson Laboratory. Injections of organoid cultures for the generation of orthotopically grafted organoid (OGO) tumors were conducted as described previously (29). Typically, 1–2.5 × 10⁵ single cells prepared from organoid cultures were resuspended as a 45 μL suspension of 50% Matrigel in PBS and injected into the pancreas. Tumors were imaged using the Vevo 3100 Ultrasound at two or three different orientations with respect to the transducer. Tumor volumes were measured at two angles, if possible, using the Vevo LAB Software program (version 2.2.0). To establish the orthotopic pancreatic cancer models with the 7940b PDAC cell line (31), 5 × 10⁴ 7940b cells (BL/6J strain) were injected into the pancreas of BL/6J or Gli1lacZ/+ heterozygous mice derived from crossing Gli1lacZ/lacZ animals maintained on a mixed genetic background (129S6/SvEvTac; C57BL/6J; Swiss Webster) with BL/6J animals (32). For Hedgehog pathway inhibition, mice were subjected to once daily oral gavage for 12 days, starting 6 days after surgical implantation of tumor cells, with either 20 mg/kg of LDE225 (Sonidegib, ChemieTek, #NVP-LDE225) resuspended in PEG400/5% dextrose solution (LDE treated) or the same volume of PEG400/5% dextrose solution alone (vehicle treated).
GEMMs
BL/6J background (>20 backcrosses) KPC (KrasLSL-G12D/+; Trp53LSL-R172H/+; Pdx1-Cre) mice used for the LDE225 study were described previously (33). KPC mice were monitored by abdominal palpation and ultrasound until tumors reached 6–8 mm in diameter. KPC mice were treated daily by oral gavage as described above with either vehicle or LDE225 for 2 weeks, and tumor volume was monitored by ultrasound. Tumors were imaged using the Vevo 3100 Ultrasound at two or three different orientations with respect to the transducer. Tumor volumes were measured at two angles, if possible, using the Vevo LAB Software program (version 2.2.0). BL/6J background iKC-Shh mice were generated by crossing iKC (Ptf1a-CreERT; KrasLSL-G12D/+; a gift from Chris Wright, Vanderbilt University) and Shh (CLEShh) mice. For; iKC-Shh mice, mutant Kras activation and/or Shh overexpression was induced by administration of three separate treatments of 5 mg per 30 g body weight of Tamoxifen (Sigma, T-5648) resuspended in corn oil when the mice were 8 weeks of age. In this model, these mice expressed mouse SHH (mRNA; GenBank, #NM009170). Mice were aged for 34 weeks post-tamoxifen treatment and then pancreata were harvested for immunostaining. To localize SHH-responding cells in vivo, we used Gli1lacz/+ reporter mice (32). Accordingly, tamoxifen was administered and pancreata were fixed for 1 hour with 4% paraformaldehyde (PFA) for 1 hour on ice, frozen in optimal cutting temperature compound (OCT), and cryo-sectioned for β-galactosidase (β-gal) staining using X-GAL substrate. Sections were counterstained with Nuclear Fast Red.
Single-cell RNA sequencing analysis
Datasets were from Elyada and colleagues (30), Peng and colleagues (34), and Steele and colleagues (35). Dimensionality reduction was carried out in Scanpy (PMC5802054) via principal component analysis on the top 3,000 highly variable genes, followed by uniform manifold approximation and projection (UMAP) visualization using the top 30 significant components. Clustering was performed with the Louvain algorithm (https://doi.org/10.1088/1742-5468/2008/10/P10008) by iterating the resolution parameter until coarse cell types could be identified by differentially expressed canonical marker genes, which were then subjected to additional rounds of cluster refinement to annotate subtypes.
Cell lines and cell culture
Ihh wild-type (WT) and Ihh-knockout (KO) 7940b KPC cells, and Gli1lacZ/lacZ murine fibroblasts (up to passage number 15) were grown in DMEM supplemented with 10% FCS and 5% Penicillin/Streptomycin (Thermo Fisher Scientific, #15140163) as described previously (15, 36). Murine PDAC T69A organoids (37) were cultured as described previously and transplanted when passage <15 (38). All cells were cultured at 37°C with 5% CO2. Cell line authentication was not performed. Mycoplasma testing with the MycoAlert Mycoplasma Detection Kit (LT07-318, Lonza) was performed monthly at Cold Spring Harbor Laboratory (Cold Spring Harbor, NY) and at University of Michigan (Ann Arbor, MI), and each organoid/cell line was tested at least once after thawing or isolation and retested prior to orthotopic transplantation experiments.
Ihh CRISPR/Cas-9 KO and SHH ectopic expression
To KO Ihh, single-guide RNAs targeting exon 1 of the Ihh gene were selected from the GeCKO library (39) and cloned into the pSpCas9(BB)-2A-Puro (PX459) V2.0 Vector backbone (Addgene, #62988). Guide insertion was validated by Sanger sequencing. The vector with guides inserted was transfected with Lipofectamine 2000 (Thermo Fisher Scientific, #11668) into 7940b KPC PDAC cells and single clones were selected by the addition of puromycin. Clones were screened by qRT-PCR with primers targeted to exon 3 of Ihh. Single clones were further validated by Sanger sequencing (data not shown). For ectopic expression of full-length SHH, Shh was cloned out from pBS mShh #CT258 (Addgene, #13999) into pMXs Vector (Addgene) and expressed in T69A PDAC organoids derived from a KPC tumor (37). Organoids were then selected with blasticidin and increased expression of SHH was confirmed by ELISA.
ELISA
For detection of SHH, we performed ELISA of media, after T69A organoid cultures were grown for 3–4 days. Media were collected, spun down, and assayed using the manufacturer's protocol (MSHH00, R&D Systems).
qRT-PCR analysis
RNA was extracted using the PureLink Mini Kit (Thermo Fisher Scientific, #12183025) as described in the manufacturer's protocol. The High-capacity cDNA Reverse Transcription Kit (Thermo Fisher Scientific, #4368814) was used to reverse transcribe RNA into cDNA. Real-time PCR assays were utilized for Shh (Mm00436528_m1), Ihh (Mm_00439613_m1), and Ppia (Mm02342430_g1). PCR amplifications were done with prevalidated 20X TaqMan Expression Assay Probes, 2X TaqMan Universal Mastermix (Thermo Fisher Scientific, #4364340), and cDNA template. Amplifications were performed in duplicate wells in a StepOne Real-Time PCR System and dCTs were normalized to Ppia housekeeping values.
Histopathologic analysis and IHC stains
Tissues were fixed overnight in 10% neutral-buffered formalin, embedded in paraffin, and sectioned. Standard procedures were used for IHC and immunofluorescence (IF). Briefly, tissues were deparaffinized with xylene or Histoclear and subjected to Citric Acid Antigen Retrieval (Thermo Fisher Scientific, NC0359148) before blocking with 1% BSA in PBS for 1 hour at room temperature. Primary antibodies were added overnight at 4°C, followed by secondary antibodies for 1 hour at room temperature. Antibodies used were: alpha smooth muscle actin (αSMA; Sigma, A2547, 1:1000 or ab5694, Abcam), Ki67 (Cell Signaling Technology, 12202, 1:100), Podoplanin (BioLegend, 127403, 1:200), Beta-galactosidase (Abcam ab9361, 1:2,500), E-Cadherin (Cell Signaling Technology, 14472S, 1:50 or 610181, BD Biosciences), Phospho-ERK (Cell Signaling Technology, 4370L, 1:100), CD31 (Cell Signaling Technology, 77699, 1:100), Cleaved Caspase 3 (Cell Signaling Technology, 9661, 1:200), CD8A (Cell Signaling Technology, 98941, 1:100), and FOXP3 (Cell signaling Technology, 12653, 1:100). For IHC, hematoxylin was used as nuclear counterstain. For IF, Alexa Fluor secondary antibodies were used (1:500). Cell nuclei were counterstained with Prolong Gold Antifade Reagent (Invitrogen, P10144) or ProLong Diamond Antifade Mountant with DAPI (Invitrogen, #P36935). Images were taken using Olympus BX53F microscope, Olympus DP80 digital camera, and CellSens Standard software. Confocal microscopy images were acquired using LeicaSP5X or SP8 confocal microscopes and Leica LAS Software. X-GAL and IF staining for β-gal were done on frozen sections. For frozen sections, tissues were fixed in 4% PFA for 1 hour at 4°C. Tissues were washed three times in PBS and incubated for 48 hours with rocking at 4°C in 30% sucrose prior to embedding in OCT compound. Frozen sections were cut at 10 μm thickness. X-GAL staining was performed with 5 nmol/L K3Fe(CN)6, 5 nmol/L K4Fe(CN)6, 2 mmol/L MgCl2, 0.01% Na-deoxycholate, 0.02% NP-40, and 1 mg/mL X-GAL (suspended in dimethylformamide) made in PBS at 37°C for 48 hours. Following this, fixed tissues were counterstained with Nuclear Fast Red for 10 minutes and subsequently mounted with Permount (VWR, #100496-550). Hematoxylin and eosin (H&E) and Masson trichrome staining were performed according to standard protocols. Histopathologic analysis of KPC tumors was performed by a pancreatic pathologist in a blinded fashion on deidentified H&E slides. Tumors were graded as moderately or poorly differentiated adenocarcinoma. Necrosis score indicated the number of low-power field (10 × objective) of necrotic area per 10 low-power fields on each slide.
ISH and dual ISH with co-IF
ISHs were performed with either the RNA Scope Multiplex Fluorescent Detection Kit (#323100, Advanced Cell Diagnostics) or Colorimetric Kits (either 322371-brown or 322360-red, Advanced Cell Diagnostics), according to the manufacturer's protocol. Murine probes for Gli1 (311001, Advanced Cell Diagnostics) and Shh (314361, Advanced Cell Diagnostics) were used. Briefly, freshly cut paraffin-embedded sections were baked for 1 hour at 60°C prior to staining. Slides were then deparaffinized and treated with hydrogen peroxide for 10 minutes at room temperature. Target retrieval was performed in a water steamer boiling for 15 minutes, and then slides were treated with the ProteasePlus Reagent (Advanced Cell Diagnostics, #322381) for 30 minutes. Following this, the RNA scope probe was hybridized for 2 hours at 40°C. The AMP5 amplification step was performed for 1 hour. For dual ISH and co-IF stains, the signal was amplified using the AMP materials provided in the ACD Multiplex Kit (320850, Advanced Cell Diagnostics). The signal was developed using 1–3 horseradish peroxidase channels depending on the number of probes and channel desired. Once completed, the samples were washed in PBS, and then blocked for 1 hour with 20% donkey serum at room temperature. Primary antibodies were incubated overnight at 4°C (αSMA, Sigma, A2547, 1:1,000; Podoplanin, BioLegend, 127403, 1:200; and E-Cadherin, Cell Signaling Technology, 14472 or 3195, 1:100). Secondary Alexa Flour antibodies (1:500 in blocking buffer) were incubated for 1 hour at room temperature, and samples were washed three times in PBS. Slides were counterstained with DAPI and mounted with ProLong Gold Antifade Mountant (Thermo Fisher Scientific, P36930).
Quantitative image analysis
Quantitative analysis was performed in at least three random nonoverlapping fields (magnification, 20×) in each sample using ImageJ, Fiji version 2.0.0-rc-69/1.52p, or Halo (Indica Labs) software to measure the percentage of positive area. At least three representative samples per group were analyzed in a blinded manner. For Gli1 ISH staining in Fig. 2M, Pannoramic SCAN Scanner (PerkinElmer) images were quantified using the Halo software algorithms to identify tissue architecture and analyze red puncta staining area across the total tissue area. For all quantitation, blood vessels, necrotic areas, and connective tissues were excluded. For quantitation of DAPI, color channels of each captured image were split and converted to binary. Cells were counted automatically (analyze → analyze particles) and results were normalized to the total number of cells in the image. To quantify particles (such as Gli1 puncta) within a specific stain, captured images were first converted to binary. Particles were selected using a binary mask of the channel containing the desired stain (edit → selection → create mask) and counted automatically (analyze → analyze particles). Results were then normalized to the total number of cells positive for the given marker. Fluorescence imaging of tissues was done with a Leica TCS SP8 Laser Scanning Confocal (Leica Microsystems), controlled by the LAS AF 3.3.10134 software. IF images were quantified using the population analysis module in Volocity (Improvision). Bright-field images of tissues were obtained with an Axio Imager.A2 (Zeiss). Stained sections were scanned with Aperio ScanScope CS and analyzed using the ImageScope Positive Pixel Count algorithm. To quantify Masson trichrome stain, hue values for blue and pink were measured using an average hue value of 0.6 and a hue width of 0.854. Percent collagen area was then determined by calculating percentage of blue pixels relative to the entire stained area. To quantify αSMA and PDPN IHC stain, the percentage of strong positive pixels was calculated relative to the entire section with the ImageScope software.
Flow cytometry and FACS
Tumors were processed as described previously (29). For flow cytometric analysis of myCAF, iCAF, and apCAF populations, cells were stained for 30 minutes with anti-mouse CD31-PE/Cy7 (102418, BioLegend), CD45-PerCP/Cy5.5 (103132, BioLegend), CD326 (Ep-CAM)-Alexa Fluor 488 (118210, BioLegend), PDPN-APC/Cy7 (127418, BioLegend), CD140a (PDGFRα)-PE (135905, BioLegend), Ly6C-APC (128015, BioLegend), and I-A/I-E (MHC-II)-BV785 (107645, BioLegend), and for 15 minutes with DAPI. Flow plots were generated with the FlowJo software. For sorting of fibroblasts from KPC tumors, cells were stained for 30 minutes with CD45-Alexa Fluor 488 (103122, BioLegend), CD326 (EpCAM)-Alexa Fluor 647 (118212, BioLegend), CD324 (E-cadherin)-Alexa Fluor 647 (147307, BioLegend), and PDPN-APC/Cy7 (127418, BioLegend), and for 15 minutes with DAPI. DAPI− CD45− EpCAM− ECAD− PDPN+ cells were sorted on the FACSAria Cell Sorter (BD) and processed for bulk RNA sequencing (RNA-seq).
RNA-seq and data analysis
Total RNA samples were isolated using TRizol according to the manufacturer's instructions. RNA concentration and quality were determined and ribosomal-depleted mRNA libraries were prepared by the University of Michigan (Ann Arbor, MI) Advanced Genomics Core. Libraries were sequenced using 150 paired-end NovaSeq 6000 (Illumina). Data are available at the NCBI Gene Expression Omnibus database under the accession number GSE156867. RNA-seq libraries were mapped to GENCODE GRCm38 primary assembly using STAR (v2.7.3), and gene expression estimations were performed using RSEM (v1.2.29). DESeq2 (v1.22.2) was used for identifying differentially expressed genes with default parameters. Genes with adjusted P values below 0.05 were selected as significant genes. Pathway enrichment analysis was conducted using gene set enrichment analysis (GSEA; v4.0.3) program and canonical pathway collections (cp_v7.0_all) available in MSigDB. To create signature gene sets, top 200 up- and downregulated differential expression genes in iCAFs versus myCAFs were selected from the study by Öhlund and colleagues (27), and defined as myCAF and iCAF gene signatures, respectively. Fisher exact test available in R was used to perform association test between differential expression genes and myCAF/iCAF signatures. All plots were produced using R. RNA-seq data of human pancreatic normal and tumor organoids were from Tiriac and colleagues (40).
Statistical analysis
GraphPad Prism software was used for graphical representation of data. Statistical analysis was performed using two-tailed Student t test, and P < 0.05 was considered statistically significant. One-way ANOVA was performed to determine whether there was any significance within the dataset. This was followed by post hoc tests using Tukey difference in means method with a P < 0.05 considered statistically significant.
Cytometry by time-of-flight
Tumors were digested as described previously (29). Up to 1 × 10⁶ cells were stained with Cell-ID cisplatin (1.67 μmol/L) for 5 minutes at room temperature. Briefly, after quenching cisplatin reaction with 5 × volume of MaxPar Cell Staining Buffer, cells were centrifuged at 300 × g for 5 minutes. Then, cells were stained with cell surface antibody cocktail (see Supplementary Table S1 for catalogue numbers and dilutions) in 100 μL volume of MaxPar Cell Staining Buffer for 30 minutes at room temperature. After being washed twice in 1 mL MaxPar Cell Staining Buffer, cells were fixed in 1.6% freshly made formaldehyde solution for 10 minutes at room temperature. Cells were washed twice with 2 mL MaxPar Cell Staining Buffer, then resuspended in 1 mL Cell Intercalation Solution (125 nmol/L Cell-ID Intercalator-Ir in Maxpar Fix and Perm Buffer), and shipped to the Flow Cytometry Core at the University of Rochester Medical Center (Rochester, NY) where sample preparation was finalized and CyTOF2 mass cytometer analyses were performed.
Cytometry by time-of-flight data analysis
Raw FCS files were analyzed using the Premium CytoBank software (cytobank.org). Data were checked for quality of staining and normalized by the use of internal bead standards. Live singlet cells were identified by using a combination of Ir191 DNA intercalator and Pt195 cisplatin stain intensity. Manual gating was performed.
Results
Hedgehog pathway activation is higher in myCAFs compared with iCAFs in PDAC
Preneoplastic pancreatic intraepithelial neoplasia (PanIN) lesions and invasive PDAC are associated with increased expression of Hedgehog ligands, which are low or undetectable in the normal pancreas (5, 6). To evaluate the expression of Hedgehog pathway components in different cellular compartments of the pancreas, we analyzed single-cell RNA-seq data (scRNA-seq) from human adjacent normal tissue or normal pancreas (n = 3) and PDAC (n = 16) samples (Fig. 1A; ref. 35). Consistent with previous studies (5, 6, 13), the expression of the SHH and IHH ligands was restricted to epithelial cells and increased in PDAC compared with adjacent normal/normal tissues, whereas the ligand desert Hedgehog (DHH) was not detected in epithelial cells, but was expressed at low levels in endothelial cells (Fig. 1B). Similarly, analysis of bulk RNA-seq of human adjacent normal/normal pancreas (n = 4) and PDAC patient–derived (n = 178) tissues from The Cancer Genome Atlas dataset indicated a significant increase in SHH and IHH in PDAC samples compared with controls, whereas DHH levels did not significantly change (Supplementary Fig. S1A). SHH and IHH transcripts were also significantly increased in PDAC patient–derived organoids (n = 63) compared with organoids isolated from normal human pancreata (n = 14; ref. 40; Supplementary Fig. S1B and S1C). On the contrary, expression of Hedgehog transcriptional targets, including GLI1, PTCH1, PTCH2, and HHIP, was enriched in PDAC fibroblasts, along with pathway components, such as SMO (41), GAS1, CDON, and BOC (Fig. 1B; refs. 11–13, 15, 42, 43). Finally, analysis of two previously published scRNA-seq datasets of human PDAC and normal pancreata (30, 34) confirmed that SHH and IHH were confined to the epithelial compartment and higher in PDAC compared with normal tissues, whereas Hedgehog target gene expression was largely restricted to fibroblasts, and generally higher in PDAC compared with nonmalignant samples (Supplementary Fig. S1D–S1G).

Hedgehog pathway activation is higher in myCAFs compared with iCAFs in PDAC. A, UMAP visualization of cell populations from scRNA-seq of human adjacent normal/normal pancreas (n = 3) and PDAC (n = 16) tissues. The normal samples (n = 3) were isolated from patients undergoing surgery for duodenal adenoma, ampullary carcinoma, or PDAC, where an uninvolved portion of the pancreas was included in the resection. Different cell type clusters are color coded. Data are from Steele and colleagues (35). B, Dot plot visualization of Hedgehog pathway gene expression level (color intensity) and frequency (size of dot) in different cell populations of human adjacent normal/normal pancreas (blue, n = 3) and PDAC (red, n = 16) samples from A. Boxes highlight Hedgehog ligands (SHH, IHH, and DHH) and Hedgehog targets (GLI1, PTCH1, PTCH2, and HHIP). C, UMAP visualization of scRNA-seq of the fibroblast clusters in pooled human adjacent normal pancreas (n = 2) and PDAC (n = 6) samples. Different CAF subtype clusters are color coded. Data are from Elyada and colleagues (30). D, UMAP visualization of myCAF (ACTA2 coding for αSMA and TAGLN) and iCAF (IL6 and CLEC3B) marker expression in the fibroblast clusters in human PDAC samples from C. E, UMAP visualization of Hedgehog target (GLI1 and PTCH1) expression in the fibroblast clusters in human PDAC samples from C. F, Heatmaps of normalized expression of Hedgehog targets (GLI1, PTCH1, PTCH2, and HHIP), Hedgehog receptor (SMO), and coreceptors (GAS1, CDON, and BOC) in each fibroblast cluster in human PDAC samples from C. Colors indicate log-scale gene counts. G, Heatmap of scaled expression of Hedgehog ligands (Shh, Ihh, and Dhh), Hedgehog targets (Gli1, Ptch1, Ptch2, and Hhip), Hedgehog receptor (Smo), and coreceptors (Gas1, Cdon, and Boc) in different cell populations of pancreatic tumors of the KPC mouse model of PDAC (n = 4). Data are scaled such that the cluster with the lowest average expression = 0 and the highest = 1 for each gene. Data are from Elyada and colleagues (30). H, Representative RNA ISH of Gli1 (white) and co-IF of PDPN (green) in a KPC tumor. Counterstain, DAPI (blue). Scale bar, 20 μm. I, Quantitation of Gli1 stain in PDPN+ (CAFs) and PDPN− (non-CAFs) cells in KPC tumors. Results show mean ± SEM of seven biological replicates. ***, P < 0.001, unpaired Student t test. J, UMAP visualization of scRNA-seq of the fibroblast clusters in KPC tumors (n = 4) from Elyada and colleagues (30). Different CAF subtype clusters are color coded. K, Heatmaps of normalized expression of Hedgehog targets (Gli1, Ptch1, Ptch2, and Hhip), Hedgehog receptor (Smo), and coreceptors (Gas1, Cdon, and Boc) in each fibroblast cluster from J. Colors indicate log-scale gene counts. L, Representative RNA ISH of Gli1 (white) and co-IF of PDPN (green) and αSMA (red) in a KPC tumor. Counterstain, DAPI (blue). Scale bar, 20 μm. The arrowhead points at a PDPN+αSMA+ cell with lower Gli1 expression; solid arrow points at a PDPN+αSMA+ cell with higher Gli1 expression. M, Quantitation of Gli1 stain in αSMA+ PDPN+ (myCAFs) and αSMA− PDPN+ (non-myCAFs) cells in KPC tumors. Results show mean ± SEM of seven biological replicates. **, P < 0.01, unpaired Student t test.
Hedgehog pathway activation is higher in myCAFs compared with iCAFs in PDAC. A, UMAP visualization of cell populations from scRNA-seq of human adjacent normal/normal pancreas (n = 3) and PDAC (n = 16) tissues. The normal samples (n = 3) were isolated from patients undergoing surgery for duodenal adenoma, ampullary carcinoma, or PDAC, where an uninvolved portion of the pancreas was included in the resection. Different cell type clusters are color coded. Data are from Steele and colleagues (35). B, Dot plot visualization of Hedgehog pathway gene expression level (color intensity) and frequency (size of dot) in different cell populations of human adjacent normal/normal pancreas (blue, n = 3) and PDAC (red, n = 16) samples from A. Boxes highlight Hedgehog ligands (SHH, IHH, and DHH) and Hedgehog targets (GLI1, PTCH1, PTCH2, and HHIP). C, UMAP visualization of scRNA-seq of the fibroblast clusters in pooled human adjacent normal pancreas (n = 2) and PDAC (n = 6) samples. Different CAF subtype clusters are color coded. Data are from Elyada and colleagues (30). D, UMAP visualization of myCAF (ACTA2 coding for αSMA and TAGLN) and iCAF (IL6 and CLEC3B) marker expression in the fibroblast clusters in human PDAC samples from C. E, UMAP visualization of Hedgehog target (GLI1 and PTCH1) expression in the fibroblast clusters in human PDAC samples from C. F, Heatmaps of normalized expression of Hedgehog targets (GLI1, PTCH1, PTCH2, and HHIP), Hedgehog receptor (SMO), and coreceptors (GAS1, CDON, and BOC) in each fibroblast cluster in human PDAC samples from C. Colors indicate log-scale gene counts. G, Heatmap of scaled expression of Hedgehog ligands (Shh, Ihh, and Dhh), Hedgehog targets (Gli1, Ptch1, Ptch2, and Hhip), Hedgehog receptor (Smo), and coreceptors (Gas1, Cdon, and Boc) in different cell populations of pancreatic tumors of the KPC mouse model of PDAC (n = 4). Data are scaled such that the cluster with the lowest average expression = 0 and the highest = 1 for each gene. Data are from Elyada and colleagues (30). H, Representative RNA ISH of Gli1 (white) and co-IF of PDPN (green) in a KPC tumor. Counterstain, DAPI (blue). Scale bar, 20 μm. I, Quantitation of Gli1 stain in PDPN+ (CAFs) and PDPN− (non-CAFs) cells in KPC tumors. Results show mean ± SEM of seven biological replicates. ***, P < 0.001, unpaired Student t test. J, UMAP visualization of scRNA-seq of the fibroblast clusters in KPC tumors (n = 4) from Elyada and colleagues (30). Different CAF subtype clusters are color coded. K, Heatmaps of normalized expression of Hedgehog targets (Gli1, Ptch1, Ptch2, and Hhip), Hedgehog receptor (Smo), and coreceptors (Gas1, Cdon, and Boc) in each fibroblast cluster from J. Colors indicate log-scale gene counts. L, Representative RNA ISH of Gli1 (white) and co-IF of PDPN (green) and αSMA (red) in a KPC tumor. Counterstain, DAPI (blue). Scale bar, 20 μm. The arrowhead points at a PDPN+αSMA+ cell with lower Gli1 expression; solid arrow points at a PDPN+αSMA+ cell with higher Gli1 expression. M, Quantitation of Gli1 stain in αSMA+ PDPN+ (myCAFs) and αSMA− PDPN+ (non-myCAFs) cells in KPC tumors. Results show mean ± SEM of seven biological replicates. **, P < 0.01, unpaired Student t test.
We next investigated whether Hedgehog signaling was differentially active in distinct human PDAC CAF subtypes. Analysis of fibroblasts from our previously published scRNA-seq dataset of human PDAC (30) revealed an enrichment of Hedgehog target genes (GLI1, PTCH1, PTCH2, and HHIP) in myCAFs compared with iCAFs (Fig. 1C–F), whereas core Hedgehog pathway components (SMO, GAS1, CDON, and BOC) were expressed in both compartments (Fig. 1F). These observations were confirmed in a second scRNA-seq dataset of human PDAC and normal pancreata (ref. 34; Supplementary Fig. S1H–S1K). To determine whether these observations were recapitulated in mouse models of PDAC, we analyzed our previously published scRNA-seq dataset of autochthonous pancreatic tumors from the KPC mouse model of PDAC (30, 33). Similar to human PDAC, murine KPC tumors express Hedgehog ligands predominantly in epithelial cells, while fibroblasts are the main Hedgehog-responsive cell type, based on target gene expression (Fig. 1G). RNA ISH of Gli1, a target gene and transcriptional mediator of the Hedgehog pathway (32), combined with co-IF of the pan-fibroblast marker podoplanin (PDPN) confirmed that Gli1 expression was restricted to PDPN+ cells in KPC tumors (Fig. 1H and I). Finally, similar to what we observed in human PDAC samples, scRNA-seq analysis of CAFs from KPC tumors demonstrated enrichment of Hedgehog target gene expression in myCAFs compared with other CAF subtypes (Fig. 1J and K; Supplementary Fig. S1L). Accordingly, RNA ISH of Gli1 with co-IF of PDPN and the myCAF marker, alpha smooth muscle actin (αSMA), showed higher Gli1 expression in myCAFs (αSMA+ PDPN+) compared with non-myCAFs (αSMA− PDPN+) in KPC tumors (Fig. 1L and M). Notably, within the myCAF population, we detected variable Gli1 levels (Fig. 1L), consistent with the heterogeneity observed in our scRNA-seq analysis of human PDAC fibroblasts (Fig. 1E).
Together, these data suggest that although all CAF subtypes are capable of responding to tumor-derived SHH and IHH ligands based on SMO, GAS1, CDON, and BOC expression, Hedgehog signaling is upregulated in myCAFs in murine and human PDAC.
Hedgehog pathway inhibition impairs PDAC growth
To gain insight into the functional role of Hedgehog signaling, we examined the consequence of Hedgehog pathway hyperactivation on PDAC progression. SHH was ectopically expressed in KPC tumor–derived PDAC organoids (37), which we then used to generate an OGO mouse model of PDAC (ref. 38; Supplementary Fig. S2A and S2B). Consistent with previous evidence (7), ectopic SHH expression in the epithelial compartment resulted in significantly increased tumor volume compared with controls (Supplementary Fig. S2C). Increased epithelial Shh expression was validated by RNA ISH of Shh with co-IF of the epithelial marker, E-cadherin (ECAD), and the fibroblast marker, PDPN (Supplementary Fig. S2D and S2E). Moreover, increased Hedgehog pathway activation in fibroblasts was confirmed by RNA ISH of Gli1 with co-IF of αSMA and PDPN (Supplementary Fig. S2F and S2G). Although SHH expression has been previously linked to formation of fibrotic stroma (7–9, 12), in this transplantation model, we did not observe a significant change in desmoplasia, as measured by Masson trichrome and αSMA stains (Supplementary Fig. S2H–S2J). Instead, SHH overexpression led to a significant increase in phospho-ERK (p-ERK) and a decrease in cleaved caspase 3 levels in epithelial cells (Supplementary Fig. S2H, S2K, and S2L), consistent with the change in tumor growth.
To further evaluate the role of Hedgehog signaling in the early stages of PDAC development, we activated the epithelial expression of Shh in the iKC (Ptf1a-CreERT; KrasLSL-G12D/+) tamoxifen-inducible GEMM of PDAC (ref. 44; Supplementary Fig. S2M). In iKC;Shh mice, mutant Kras activation and SHH overexpression are simultaneously induced in acinar cells by Cre recombination upon tamoxifen administration. To validate the increase in Hedgehog activation, Ptf1aCreERT;Shh mice were crossed to Gli1lacZ/+ animals, which read out Hedgehog pathway activity through the measurement of β-gal activity (32). The resulting Ptf1aCreERT;Gli1lacZ/+;Shh mice were then treated with tamoxifen at 8 weeks old and aged for 34 weeks (Supplementary Fig. S2N). Compared with control Ptf1aCreERT;Gli1lacz/+ pancreata, Ptf1aCreERT;Gli1lacZ/+;Shh pancreata had increased numbers of X-GAL+ cells (Supplementary Fig. S2O), confirming that SHH overexpression in acinar cells results in increased Hedgehog activation. Notably, iKC;Shh mice exhibited an increase in preneoplastic PanIN lesions, compared with tamoxifen-treated iKC mice, WT mice, and Ptf1aCreERT;Shh controls (Supplementary Fig. S2P), consistent with the notion that Hedgehog pathway activation promotes PDAC formation (7–9, 12). Furthermore, consistent with the more advanced lesions, pancreata from iKC;Shh mice displayed more abundant p-ERK compared with tamoxifen-treated iKC mice, WT mice, and Ptf1aCreERT;Shh controls (Supplementary Fig. S2P). SHH overexpression in iKC;Shh mice also led to increased desmoplasia, as evaluated by Masson trichrome and αSMA stains (Supplementary Fig. S2P), indicating that Hedgehog pathway activation prior to tumor formation in this GEMM has a greater effect on stroma remodeling compared with transplantation models of murine PDAC cells (Supplementary Fig. S2H–S2J).
We next investigated the effects of Hedgehog ligand depletion on PDAC progression. Whereas the effect of SHH deletion in PDAC has been investigated previously (22, 23), the role of IHH has not been addressed, despite the observation that both ligands are expressed in both human and mouse pancreatic cancer. We therefore deleted Ihh using CRISPR/Cas9 in a KPC PDAC cell line that expressed low levels of Shh (ref. 31; Supplementary Fig. S3A and S3B). Ihh WT PDAC cells induced Hedgehog pathway activation in cocultured Gli1lacZ/lacZ fibroblasts (15), as evidenced by staining for β-gal, whereas Ihh-KO cells failed to do so (Supplementary Fig. S3C). Orthotopic transplantation of Ihh-KO PDAC cells in BL/6J mice showed no difference in tumor growth compared with control WT cells (Supplementary Figs. S2A and S2B and S3D–S3F), although Hedgehog pathway inhibition was confirmed by RNA ISH of Gli1 (Fig. 2C and D). We reasoned that Ihh-KO PDAC cells transplanted in BL/6J mice potentially retained low-level Hedgehog activity. As we have identified previously a dosage-dependent role of Hedgehog signaling in pancreatic cancer progression (15), we evaluated the impact of Ihh deletion on PDAC progression in Gli1lacz/+ mice that lack one copy of Gli1. These mice have systemically lower Hedgehog signaling levels and display defects in Hedgehog-responsive adult homeostatic and repair processes (45–47). Notably, transplantation of Ihh-KO PDAC cells into the pancreas of Gli1lacz/+ mice resulted in significantly smaller tumors compared with control WT cells (Fig. 2A and B; Supplementary Fig. S3D–S3F). Hedgehog pathway inhibition was confirmed by X-GAL staining and co-IF for β-gal and αSMA (Fig. 2C and E). We next utilized a selective SMO antagonist to pharmacologically inhibit Hedgehog signaling in both BL/6J and Gli1lacz/+ mice orthotopically transplanted with PDAC cells. Once a palpable mass was detected, mice were treated once daily by oral gavage with the SMO inhibitor, LDE225 (48), for 12 days (Fig. 2F). LDE225 is an effective inhibitor of the Hedgehog pathway, acting downstream of all Hedgehog ligands by targeting SMO, and is in active clinical use (48–50). Similar to what was observed with Ihh deletion, pharmacologic Hedgehog pathway inhibition resulted in smaller tumors only in Gli1lacz/+ mice (Fig. 2G; Supplementary Fig. S3G–S3I), which lack one copy of Gli1 and thus, have lower levels of Hedgehog signaling at baseline before tumor cells are transplanted. RNA ISH of Gli1, X-GAL staining, and β-gal/αSMA co-IF confirmed Hedgehog pathway inhibition in both models (Fig. 2H–J). Overall, these data are consistent with previous reports in which Gli1-null animals exhibited decreased progression of pancreatic preneoplastic lesions, and the loss of one copy of Gli1 had an impact on pancreatic tissue homeostasis (45, 51).

Hedgehog pathway inhibition impairs PDAC growth. A, Schematic of orthotopic transplantation of 7940b KPC PDAC cells with Ihh WT or KO in BL/6J or Gli1lacZ/+ mice. B, Tumor weights at day 18 after transplantation of the experiment from A. Results show mean ± SEM of six biological replicates. **, P < 0.01, one-way ANOVA. C, Representative RNA ISH images of Gli1 in Ihh WT or -KO tumors in BL/6J mice (left), and of X-GAL stain and co-IF of αSMA (magenta), β-gal (green), and DAPI (blue) in Ihh WT or -KO tumors in Gli1lacZ/+ mice (middle and right). Inserts, magnifications. Scale bars, 50 μm (left), 100 μm (middle), and 25 μm (right). D, Quantitation of Gli1 RNA ISH in Ihh WT or -KO tumors in BL/6J mice. Results show mean ± SEM on six biological replicates. ***, P < 0.001, unpaired Student t test. E, Quantitation of X-GAL stain in Ihh WT or -KO tumors in Gli1lacZ/+ mice. Results show mean ± SEM on six biological replicates. **, P < 0.01, unpaired Student t test. F, Schematic of orthotopic transplantation of 7940b KPC PDAC cells into BL/6J or Gli1lacZ/+ mice, followed by a 12-day treatment with 20 mg/kg SMO inhibitor, LDE225, or vehicle by daily oral gavage. G, Tumor weights at day 18 after transplantation of the experiment from F. Results show mean ± SEM of 4–6 biological replicates. ***, P < 0.001, one-way ANOVA. H, Representative RNA ISH images of Gli1 in vehicle- or LDE225-treated tumors in BL/6J mice (left), and of X-GAL stain and co-IF of αSMA (red), β-gal (green), and DAPI (blue) in vehicle- or LDE225-treated tumors in Gli1lacZ/+ mice (middle and right). Inserts, magnifications. Scale bars, 50 μm (left), 100 μm (middle), and 25 μm (right). I, Quantitation of Gli1 RNA ISH in LDE225- or vehicle-treated tumors in BL/6J mice. Results show mean ± SEM on four biological replicates. ***, P < 0.001, unpaired Student t test. J, Quantitation of X-GAL stain in LDE225- or vehicle- treated tumors in Gli1lacZ/+ mice. Results show mean ± SEM on four biological replicates. ***, P < 0.001, unpaired Student t test. K, Schematic of 2-week treatment of tumor-bearing KPC mice with 20 mg/kg LDE225 or vehicle by daily oral gavage. U/S, ultrasound. L, Tumor volume as measured by ultrasound of vehicle- (n = 9) and LDE225-treated (n = 8) KPC tumors from K. Results show mean ± SEM. *, P < 0.05, unpaired Student t test. M, Representative RNA ISH of Gli1 in 2-week vehicle- (n = 11) and LDE225-treated (n = 10) KPC tumors. Scale bar, 100 μm. N, Quantitation of Gli1 stain in vehicle- (n = 11) and LDE225-treated (n = 10) KPC tumors. Results show mean ± SEM. ***, P < 0.001, unpaired Student t test.
Hedgehog pathway inhibition impairs PDAC growth. A, Schematic of orthotopic transplantation of 7940b KPC PDAC cells with Ihh WT or KO in BL/6J or Gli1lacZ/+ mice. B, Tumor weights at day 18 after transplantation of the experiment from A. Results show mean ± SEM of six biological replicates. **, P < 0.01, one-way ANOVA. C, Representative RNA ISH images of Gli1 in Ihh WT or -KO tumors in BL/6J mice (left), and of X-GAL stain and co-IF of αSMA (magenta), β-gal (green), and DAPI (blue) in Ihh WT or -KO tumors in Gli1lacZ/+ mice (middle and right). Inserts, magnifications. Scale bars, 50 μm (left), 100 μm (middle), and 25 μm (right). D, Quantitation of Gli1 RNA ISH in Ihh WT or -KO tumors in BL/6J mice. Results show mean ± SEM on six biological replicates. ***, P < 0.001, unpaired Student t test. E, Quantitation of X-GAL stain in Ihh WT or -KO tumors in Gli1lacZ/+ mice. Results show mean ± SEM on six biological replicates. **, P < 0.01, unpaired Student t test. F, Schematic of orthotopic transplantation of 7940b KPC PDAC cells into BL/6J or Gli1lacZ/+ mice, followed by a 12-day treatment with 20 mg/kg SMO inhibitor, LDE225, or vehicle by daily oral gavage. G, Tumor weights at day 18 after transplantation of the experiment from F. Results show mean ± SEM of 4–6 biological replicates. ***, P < 0.001, one-way ANOVA. H, Representative RNA ISH images of Gli1 in vehicle- or LDE225-treated tumors in BL/6J mice (left), and of X-GAL stain and co-IF of αSMA (red), β-gal (green), and DAPI (blue) in vehicle- or LDE225-treated tumors in Gli1lacZ/+ mice (middle and right). Inserts, magnifications. Scale bars, 50 μm (left), 100 μm (middle), and 25 μm (right). I, Quantitation of Gli1 RNA ISH in LDE225- or vehicle-treated tumors in BL/6J mice. Results show mean ± SEM on four biological replicates. ***, P < 0.001, unpaired Student t test. J, Quantitation of X-GAL stain in LDE225- or vehicle- treated tumors in Gli1lacZ/+ mice. Results show mean ± SEM on four biological replicates. ***, P < 0.001, unpaired Student t test. K, Schematic of 2-week treatment of tumor-bearing KPC mice with 20 mg/kg LDE225 or vehicle by daily oral gavage. U/S, ultrasound. L, Tumor volume as measured by ultrasound of vehicle- (n = 9) and LDE225-treated (n = 8) KPC tumors from K. Results show mean ± SEM. *, P < 0.05, unpaired Student t test. M, Representative RNA ISH of Gli1 in 2-week vehicle- (n = 11) and LDE225-treated (n = 10) KPC tumors. Scale bar, 100 μm. N, Quantitation of Gli1 stain in vehicle- (n = 11) and LDE225-treated (n = 10) KPC tumors. Results show mean ± SEM. ***, P < 0.001, unpaired Student t test.
As the accelerated tumor growth kinetics of these transplantation models of PDAC could prevent the observation of more subtle changes in tumor volume upon Hedgehog pathway inhibition, we investigated the effect of using LDE225 in the KPC mouse model. KPC mice were enrolled in either the control or treatment arm of the study once tumors were detected by ultrasound. Interestingly, a 2-week treatment with LDE225 led to an impairment of tumor growth in the KPC model (Fig. 2K and L; Supplementary Fig. S3J). Ablation of Hedgehog signaling was confirmed by RNA ISH of Gli1 (Fig. 2M and N). Although no changes in tumor necrosis, differentiation, epithelial apoptosis, and epithelial proliferation were observed (Supplementary Fig. S3K–S3P), we observed a moderate, but significant reduction in p-ERK levels in epithelial cells upon Hedgehog pathway inhibition (Supplementary Fig. S3Q and S3R).
Taken together, these data indicate that, consistent with prior studies, Hedgehog signaling generally promotes PDAC progression, that both SHH and IHH contribute to pancreatic cancer growth, and that the degree of contribution of Hedgehog signaling to tumor growth is dependent on the level of Hedgehog pathway activity.
Hedgehog pathway inhibition alters the fibroblast compartment in PDAC
In contrast to previous work that inhibited Hedgehog signaling (19, 22, 23), 2-week LDE225 treatment did not alter the amount of collagen deposition, as measured by Masson trichrome stain (Supplementary Fig. S4A and S4B), or vasculature, as evaluated by IHC for CD31 (Supplementary Fig. S4C and S4D), in KPC tumors. However, 2-week Hedgehog pathway inhibition resulted in a reduction in PDPN+ cells (Fig. 3A and B). To further investigate this, we isolated PDPN+ DAPI− CD45− EpCAM− CAFs from 2-week vehicle- and LDE225-treated KPC tumors by FACS and performed bulk RNA-seq (Fig. 3C; Supplementary Fig. S4E). GSEA and differential expression of Hedgehog targets confirmed significant downregulation of Hedgehog signaling in CAFs isolated from LDE225-treated tumors compared with vehicle-treated controls (Supplementary Fig. S4F–S4H). We then assessed what secreted factors were downregulated by LDE225 treatment in the RNA-seq dataset. We found that growth factors, including Wnt5a, Tgfb1, and Sema3a, and angiogenic factors, such as Angpt4 and Vegfa, were downregulated in fibroblasts isolated from LDE225-treated KPC tumors compared with controls (Supplementary Fig. S4I). In addition, genes encoding ECM proteins, including Col4a1, Col4a6, and Mmp15, were also downregulated upon LDE225 treatment (Supplementary Fig. S4I). Thus, we detected Hedgehog inhibition–dependent ECM-related gene expression alterations and additional changes in fibroblast-secreted factors that could provide an explanation for the reduction in tumor growth. Moreover, in accordance with the observed decrease in fibroblasts, the cell proliferation gene signature and proliferation markers were significantly reduced in CAFs isolated from LDE225-treated tumors compared with vehicle-treated controls (Fig. 3D and E). Given that Hedgehog pathway activity is higher in myCAFs compared with other CAF subtypes in KPC tumors (Fig. 1K–M), we investigated the consequences of LDE225 treatment on myCAF and non-myCAF populations. IHC of αSMA and co-IF detection of αSMA and PDPN to identify myCAFs (PDPN+ αSMA+) and non-myCAFs (PDPN+ αSMA−) not only revealed a decrease in αSMA+ myofibroblasts (Fig. 3F and G; Supplementary Fig. S4J and S4K), consistent with prior studies (19, 22, 23), but also showed an increase in non-myCAFs (Fig. 3F and H) in LDE225-treated tumors compared with vehicle-treated controls. Overall, these fibroblast changes resulted in a significant decrease in the myCAF/non-myCAF ratio (Supplementary Fig. S4L).

Two-week Hedgehog pathway inhibition alters the fibroblast compartment in PDAC. A, Representative IHC of PDPN in vehicle- (n = 10) and LDE225-treated (n = 11) KPC tumors. Scale bar, 50 μm. B, Quantitation of PDPN stain in vehicle- (n = 10) and LDE225-treated (n = 11) KPC tumors. Results show mean ± SEM. **, P < 0.01, unpaired Student t test. C, Schematic of FACS strategy for bulk RNA-seq of fibroblasts from vehicle- and LDE225-treated KPC tumors. D, GSEA of cell-cycle signature in FACS-sorted CAFs from LDE225-treated KPC tumors (n = 2) compared with FACS-sorted CAFs from vehicle-treated controls (n = 3). E, RNA-seq expression of proliferation markers (Mki67, Ccnb2, and Cks2) in FACS-sorted CAFs from vehicle- (n = 3) and LDE225-treated (n = 2) KPC tumors. Results show mean ± SEM. *, P < 0.05; **, P < 0.01; ***, P < 0.001, unpaired Student t test. F, Co-IF of αSMA (red) and PDPN (green) in vehicle- (n = 7) and LDE225-treated (n = 4) KPC tumors. Counterstain, DAPI. Scale bar, 20 μm. G, Quantitation of myCAFs (αSMA+ PDPN+ DAPI+) in vehicle- (n = 7) and LDE225-treated (n = 4) KPC tumors. Results show mean ± SEM. P = 0.05, unpaired Student t test. H, Quantitation of non-myCAFs (αSMA− PDPN+ DAPI+) in vehicle- (n = 7) and LDE225-treated (n = 4) KPC tumors. Results show mean ± SEM. *, P < 0.05, unpaired Student t test.
Two-week Hedgehog pathway inhibition alters the fibroblast compartment in PDAC. A, Representative IHC of PDPN in vehicle- (n = 10) and LDE225-treated (n = 11) KPC tumors. Scale bar, 50 μm. B, Quantitation of PDPN stain in vehicle- (n = 10) and LDE225-treated (n = 11) KPC tumors. Results show mean ± SEM. **, P < 0.01, unpaired Student t test. C, Schematic of FACS strategy for bulk RNA-seq of fibroblasts from vehicle- and LDE225-treated KPC tumors. D, GSEA of cell-cycle signature in FACS-sorted CAFs from LDE225-treated KPC tumors (n = 2) compared with FACS-sorted CAFs from vehicle-treated controls (n = 3). E, RNA-seq expression of proliferation markers (Mki67, Ccnb2, and Cks2) in FACS-sorted CAFs from vehicle- (n = 3) and LDE225-treated (n = 2) KPC tumors. Results show mean ± SEM. *, P < 0.05; **, P < 0.01; ***, P < 0.001, unpaired Student t test. F, Co-IF of αSMA (red) and PDPN (green) in vehicle- (n = 7) and LDE225-treated (n = 4) KPC tumors. Counterstain, DAPI. Scale bar, 20 μm. G, Quantitation of myCAFs (αSMA+ PDPN+ DAPI+) in vehicle- (n = 7) and LDE225-treated (n = 4) KPC tumors. Results show mean ± SEM. P = 0.05, unpaired Student t test. H, Quantitation of non-myCAFs (αSMA− PDPN+ DAPI+) in vehicle- (n = 7) and LDE225-treated (n = 4) KPC tumors. Results show mean ± SEM. *, P < 0.05, unpaired Student t test.
Our findings indicate that fibroblast proliferation is affected upon LDE225 treatment, which may partly explain the reduction in myofibroblasts seen in Hedgehog inhibitor–treated tumors. Overall, our data corroborate a role for the Hedgehog pathway inhibitor, LDE225, in targeting the fibroblast compartment and preferentially depleting myofibroblasts over non-myCAFs in PDAC.
Hedgehog pathway inhibition alters the ratio of myCAFs and iCAFs in PDAC
We next used a previously established flow cytometry approach (29, 30) to further evaluate myCAFs (PDPN+ MHCII− LY6C−), iCAFs (PDPN+ MHCII− LY6C+), and apCAFs (PDPN+ LY6C− MHCII+) in 2-week vehicle- and LDE225-treated KPC tumors (Fig. 4A). Hedgehog pathway inhibition resulted in a reduction in myCAF numbers and a significant expansion of iCAFs (Fig. 4B–E), leading to an increase in the iCAF/myCAF ratio (Fig. 4F).
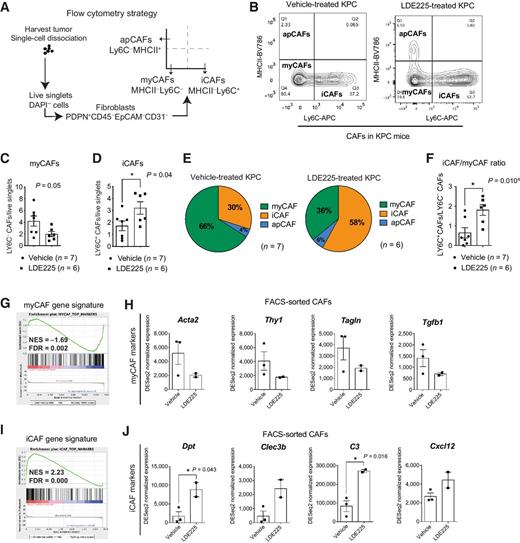
Two-week Hedgehog pathway inhibition alters the ratio of myCAFs and iCAFs in PDAC. A, Schematic of flow cytometry strategy for myCAFs and iCAFs from 2-week vehicle- and LDE225-treated KPC tumors. B, Representative flow plots showing the gating strategy for the analysis of DAPI− CD45− CD31− EpCAM− PDPN+ CAFs in 2-week vehicle- (n = 7) and LDE225-treated (n = 6) KPC tumors. C, Flow cytometry analysis of myCAFs (calculated from DAPI+ singlets) in vehicle- (n = 7) and LDE225-treated (n = 6) KPC tumors. Results show mean ± SEM. Unpaired Student t test. D, Flow cytometry analysis of iCAFs (calculated from DAPI+ singlets) in vehicle- (n = 7) and LDE225-treated (n = 6) KPC tumors. Results show mean ± SEM. *, P < 0.05, unpaired Student t test. E, Proportions of myCAF, iCAF, and apCAF subtypes from the PDPN+ gate in vehicle- (n = 7, top) and LDE225-treated (n = 6, bottom) KPC tumors, as measured by flow cytometry analysis. Results show average percentage of biological replicates. F, Flow cytometric analysis of the iCAF/myCAF ratio from the PDPN+ gate in vehicle- (n = 7) and LDE225-treated (n = 6) KPC tumors. Results show mean ± SEM. *, P < 0.05, unpaired Student t test. G, GSEA of the myCAF gene signature in FACS-sorted CAFs from 2-week LDE225-treated KPC tumors (n = 2) compared with FACS-sorted CAFs from vehicle-treated controls (n = 3). The myCAF gene signature was defined from the study by Öhlund and colleagues (27). H, RNA-seq expression of myCAF markers (Acta2, Thy1, Tagln, and Tgfb1) in FACS-sorted CAFs from vehicle- (n = 3) and LDE225-treated (n = 2) KPC tumors. Results show mean ± SEM. No statistical difference was observed as calculated by unpaired Student t test. I, GSEA of the iCAF gene signature in FACS-sorted CAFs from 2-week LDE225-treated KPC tumors (n = 2) compared with FACS-sorted CAFs from vehicle-treated controls (n = 3). The iCAF gene signature was defined from the study by Öhlund and colleagues (27). J, RNA-seq expression of iCAF markers (Dpt, Clec3b, C3, and Cxcl12) in FACS-sorted CAFs from vehicle- (n = 3) and LDE225-treated (n = 2) KPC tumors. Results show mean ± SEM. *, P < 0.05, unpaired Student t test.
Two-week Hedgehog pathway inhibition alters the ratio of myCAFs and iCAFs in PDAC. A, Schematic of flow cytometry strategy for myCAFs and iCAFs from 2-week vehicle- and LDE225-treated KPC tumors. B, Representative flow plots showing the gating strategy for the analysis of DAPI− CD45− CD31− EpCAM− PDPN+ CAFs in 2-week vehicle- (n = 7) and LDE225-treated (n = 6) KPC tumors. C, Flow cytometry analysis of myCAFs (calculated from DAPI+ singlets) in vehicle- (n = 7) and LDE225-treated (n = 6) KPC tumors. Results show mean ± SEM. Unpaired Student t test. D, Flow cytometry analysis of iCAFs (calculated from DAPI+ singlets) in vehicle- (n = 7) and LDE225-treated (n = 6) KPC tumors. Results show mean ± SEM. *, P < 0.05, unpaired Student t test. E, Proportions of myCAF, iCAF, and apCAF subtypes from the PDPN+ gate in vehicle- (n = 7, top) and LDE225-treated (n = 6, bottom) KPC tumors, as measured by flow cytometry analysis. Results show average percentage of biological replicates. F, Flow cytometric analysis of the iCAF/myCAF ratio from the PDPN+ gate in vehicle- (n = 7) and LDE225-treated (n = 6) KPC tumors. Results show mean ± SEM. *, P < 0.05, unpaired Student t test. G, GSEA of the myCAF gene signature in FACS-sorted CAFs from 2-week LDE225-treated KPC tumors (n = 2) compared with FACS-sorted CAFs from vehicle-treated controls (n = 3). The myCAF gene signature was defined from the study by Öhlund and colleagues (27). H, RNA-seq expression of myCAF markers (Acta2, Thy1, Tagln, and Tgfb1) in FACS-sorted CAFs from vehicle- (n = 3) and LDE225-treated (n = 2) KPC tumors. Results show mean ± SEM. No statistical difference was observed as calculated by unpaired Student t test. I, GSEA of the iCAF gene signature in FACS-sorted CAFs from 2-week LDE225-treated KPC tumors (n = 2) compared with FACS-sorted CAFs from vehicle-treated controls (n = 3). The iCAF gene signature was defined from the study by Öhlund and colleagues (27). J, RNA-seq expression of iCAF markers (Dpt, Clec3b, C3, and Cxcl12) in FACS-sorted CAFs from vehicle- (n = 3) and LDE225-treated (n = 2) KPC tumors. Results show mean ± SEM. *, P < 0.05, unpaired Student t test.
We then investigated whether Hedgehog pathway inhibition resulted in an alteration of the iCAF and myCAF signatures, using previously established gene signatures (27), in the bulk RNA-seq dataset of FACS-sorted CAFs from 2-week vehicle- and LDE225-treated KPC tumors (Fig. 3C; Supplementary Fig. S4E). In accordance with the flow cytometric data, this analysis revealed downregulation of the myCAF gene expression signature, as well as downregulation of specific myCAF markers upon LDE225 treatment (Fig. 4G and H). In addition, we observed an upregulation of the iCAF signature and iCAF markers in LDE225-treated KPC tumors compared with vehicle-treated controls (Fig. 4I and J).
These data indicate that Hedgehog signaling is a key pathway for the maintenance of the myCAF phenotype, and its inhibition alters the ratio of myCAFs and iCAFs in PDAC.
Hedgehog pathway inhibition alters the immune infiltration in pancreatic tumors
As iCAFs are a source of inflammatory signals (27, 29, 30), we investigated the consequences of increased iCAF numbers, induced by Hedgehog pathway inhibition, on immune composition. Cytometry by time-of-flight (CyTOF) analysis of dissociated KPC tumors allowed for evaluation of multiple immune populations (Fig. 5A; Supplementary Table S1). We observed no change in total B cells (CD45+CD19+), natural killer cells (CD45+CD161+), myeloid cells (CD45+CD11b+), granulocytic immature myeloid cells (Ly6G+Ly6C+), and macrophages (CD11b+F4/80+) upon 2-week Hedgehog pathway inhibition treatment (Fig. 5B; Supplementary Fig. S5A). However, Ly6C+Ly6G− monocytic immature myeloid cells, PD-L1+ macrophages, and CD206+ macrophages significantly increased upon LDE225 treatment (Fig. 5B; Supplementary Fig. S5A). Among different populations of dendritic cells, only total CD11b+CD11c+CD206+CD45+Lin−F4/80− cells were significantly upregulated (Supplementary Fig. S5B). Total CD3+, CD4+, and CD8+ T-cell infiltration was variable across samples, and while we observed a trend toward fewer T cells, there was no significant difference (Supplementary Fig. S5C). However, the relative abundance of T-cell subsets, when measured as a percentage of total CD3+ T cells, was altered, as Hedgehog pathway inhibition significantly decreased CD8+ T cells and increased CD4+ T cells and CD25+CD4+ T cells (potential regulatory T cells; Fig. 5C). Accordingly, by IHC, we observed fewer CD8+ T cells (Fig. 5D and E) and more abundant FOXP3+ regulatory T cells (Fig. 5F and G) in 2-week LDE225-treated KPC tumors compared with vehicle-treated controls.

Two-week Hedgehog (HH) pathway inhibition alters the immune infiltration in pancreatic tumors. A, Schematic of 2-week treatment of tumor-bearing KPC mice with 20 mg/kg LDE225 or vehicle prior to CyTOF analysis (top). U/S, ultrasound. Table of CyTOF panel including metal tag, antibody target, and cell type predominantly expressed (bottom). See Supplementary Table S1 for detailed antibody information. B, Manual gating of CyTOF data for total myeloid cells (CD45+CD11b+), macrophages (CD11b+F4/80+), PDL1+ macrophages (F4/80+PD-L1+), and CD206+ macrophages (F4/80+CD206+) in 2-week vehicle- (n = 7) and LDE225-treated (n = 6) KPC tumors. Results show mean ± SEM. *, P < 0.05, unpaired Student t test. C, Manual gating of CyTOF data for CD8+, CD4+, and CD4+CD25+ T cells as a percentage of total CD3+ T cells. Results show mean ± SEM. *, P < 0.05; **, P < 0.01, unpaired Student t test. D, Representative IHC of CD8A in 2-week vehicle- and LDE225-treated KPC tumors. Inserts, magnifications. Scale bar, 50 μm. E, Quantitation of CD8A stain in 2-week vehicle- (n = 12) and LDE225-treated (n = 11) KPC tumors. Results show mean ± SEM. *, P < 0.05, unpaired Student t test. F, Representative IHC of FOXP3 in 2-week vehicle- and LDE225-treated KPC tumors. Inserts, magnifications. Scale bar, 50 μm. G, Quantitation of FOXP3 stain in 2-week vehicle- (n = 12) and LDE225-treated (n = 11) KPC tumors. Results show mean ± SEM. **, P < 0.01, unpaired Student t test. H, Model explaining the role of Hedgehog signaling and the effects of Hedgehog inhibition on the PDAC microenvironment. Cancer-secreted Hedgehog ligands, such as SHH and IHH, activate Hedgehog signaling in surrounding fibroblasts (arrow), especially in myCAFs (left). Hedgehog inhibition leads to a reduction in myCAFs and an increase in iCAFs, and to decreased CD8+ T cells and more abundant regulatory T cells (right).
Two-week Hedgehog (HH) pathway inhibition alters the immune infiltration in pancreatic tumors. A, Schematic of 2-week treatment of tumor-bearing KPC mice with 20 mg/kg LDE225 or vehicle prior to CyTOF analysis (top). U/S, ultrasound. Table of CyTOF panel including metal tag, antibody target, and cell type predominantly expressed (bottom). See Supplementary Table S1 for detailed antibody information. B, Manual gating of CyTOF data for total myeloid cells (CD45+CD11b+), macrophages (CD11b+F4/80+), PDL1+ macrophages (F4/80+PD-L1+), and CD206+ macrophages (F4/80+CD206+) in 2-week vehicle- (n = 7) and LDE225-treated (n = 6) KPC tumors. Results show mean ± SEM. *, P < 0.05, unpaired Student t test. C, Manual gating of CyTOF data for CD8+, CD4+, and CD4+CD25+ T cells as a percentage of total CD3+ T cells. Results show mean ± SEM. *, P < 0.05; **, P < 0.01, unpaired Student t test. D, Representative IHC of CD8A in 2-week vehicle- and LDE225-treated KPC tumors. Inserts, magnifications. Scale bar, 50 μm. E, Quantitation of CD8A stain in 2-week vehicle- (n = 12) and LDE225-treated (n = 11) KPC tumors. Results show mean ± SEM. *, P < 0.05, unpaired Student t test. F, Representative IHC of FOXP3 in 2-week vehicle- and LDE225-treated KPC tumors. Inserts, magnifications. Scale bar, 50 μm. G, Quantitation of FOXP3 stain in 2-week vehicle- (n = 12) and LDE225-treated (n = 11) KPC tumors. Results show mean ± SEM. **, P < 0.01, unpaired Student t test. H, Model explaining the role of Hedgehog signaling and the effects of Hedgehog inhibition on the PDAC microenvironment. Cancer-secreted Hedgehog ligands, such as SHH and IHH, activate Hedgehog signaling in surrounding fibroblasts (arrow), especially in myCAFs (left). Hedgehog inhibition leads to a reduction in myCAFs and an increase in iCAFs, and to decreased CD8+ T cells and more abundant regulatory T cells (right).
Thus, the observed increase in iCAFs upon Hedgehog inhibition correlated with changes in immune infiltration that are consistent with a more immunosuppressive pancreatic cancer microenvironment (Fig. 5H).
Discussion
A distinguishing feature of pancreatic cancer is an extensive stromal reaction. Among these stromal components, heterogeneous fibroblast subtypes have potentially distinct contributions to pancreatic cancer progression (24, 25, 27–30, 52, 53). Hedgehog signaling is a key pathway activated in fibroblasts in pancreatic cancer; however, contradictory genetic and pharmacologic studies in mouse models, as well as disappointing clinical trials with Hedgehog pathway inhibitors indicate a complicated and potentially multifactorial contribution of the Hedgehog pathway to pancreatic cancer progression. Here, we confirm that Hedgehog pathway activation, as evidenced by expression of Hedgehog targets, such as Gli1, is restricted to the fibroblast compartment. Notably, we demonstrate that Hedgehog signaling is enriched in the myCAF subset compared with other CAF subtypes in both mouse models of PDAC and human pancreatic cancer. Moreover, we show that short-term Hedgehog pathway inhibition with LDE225 results in myCAF depletion and iCAF enrichment, altering fibroblast composition toward a more fibroinflammatory stroma.
A particularly vexing question is why different studies reached distinct conclusions about the role of Hedgehog signaling in pancreatic cancer. One potential answer lies in the approaches used to target the Hedgehog pathway. Prior work demonstrated a tumor-restrictive role for Hedgehog signaling through genetic ablation of epithelial Shh (22, 23). However, as noted previously (6) and confirmed here, pancreatic cancer cells express both Shh and Ihh. Furthermore, genetic deletion of Shh in a GEMM of PDAC resulted in a corresponding, and potentially compensatory, increase in Ihh expression (22). Here, we demonstrate that Ihh KO results in decreased tumor size when implanting PDAC cells that do not produce significant levels of Shh and in the context of a genetically sensitized background (i.e., in Gli1lacz/+ mice that lack one copy of Gli1). Together, these data indicate that targeting of both Shh and Ihh is required to fully discern the contribution of Hedgehog signaling to pancreatic cancer growth.
An additional explanation for discord in the field may lie with the use of different pharmacologic Hedgehog pathway inhibitors. While previous studies employed Vismodegib (Genentech) and IPI-926 (Infinity Pharmaceuticals; refs. 19, 22, 23), we utilized LDE225 (Sonidegib, Novartis; ref. 48), which is still being clinically evaluated for PDAC (NCT02358161). Notably, although all three inhibitors target SMO, these compounds display distinct pharmacokinetics in mice (49, 50), which could result in different degrees of Hedgehog pathway inhibition in the pancreatic stroma. In support of this notion, vismodegib treatment only partially reduced Gli1 expression in a mouse model of pancreatic cancer (23), whereas LDE225 treatment resulted in near complete abrogation of Gli1 expression in both orthotopic transplantation models of PDAC and KPC tumors. An important consideration in previous studies, as well as in this work, is the potential impact of different levels of Hedgehog pathway activity on pancreatic tumor growth. Hedgehog ligands are best known as morphogens, where specific Hedgehog ligand concentrations induce distinct cellular outcomes (54). The duration of Hedgehog pathway activity is also essential in determining cellular responses (54). The outcome of Hedgehog signaling is regulated by the dynamic and overlapping contributions of various cell surface receptors (15). Furthermore, GLI proteins, the transcriptional effectors of the Hedgehog pathway, also impact pancreatic tumor growth (45, 55). Finally, in Gli1lacz/+ mice, Hedgehog signaling is lowered systemically (32) prior to tumor formation, which may explain the different outcomes observed upon further Hedgehog inhibition by treatment with LDE225, when compared with BL/6J transplantation models. Altogether, previous work from our group (15) and our current data support the notion that Hedgehog signaling plays dosage-dependent, and perhaps timing-dependent, roles in pancreatic cancer with the best outcome in terms of inhibition of tumor growth, when the pathway is completely inactivated, rather than partially inhibited.
Here, we demonstrate that Hedgehog pathway inhibition alters the ratio of fibroblast subtypes in pancreatic cancer by altering myCAF abundance. Although all CAF subtypes appear to express the necessary receptors to respond to Hedgehog ligands, we observed preferential Hedgehog pathway activation in myCAFs. This observation could be due to the tumor proximal location of myCAFs (27), which positions them closer to the source of Hedgehog ligands. This raises the question of whether genetic depletion of αSMA+ myofibroblasts (56) may result in inappropriate activation of Hedgehog signaling in iCAFs and apCAFs, which may promote disease progression.
Our observations indicate that detrimental effects associated with long-term Hedgehog pathway inhibition may not be due to the depletion of a tumor-restraining myCAF population, as suggested previously (22, 42), but instead may depend on the enrichment of a potentially tumor-promoting iCAF subtype. Indeed, previous work from our laboratories has suggested a tumor-promoting role of iCAFs (27, 29, 36, 57). Although the change in fibroblast composition observed upon a 2-week period of Hedgehog inhibition did not lead to more aggressive PDAC, in the long term it may cause the detrimental effects observed in previous studies, as iCAFs secrete ligands responsible for conditions such as immunosuppression and cachexia (27, 30, 58–60). In support of this notion, we find that Hedgehog inhibition leads to a more immunosuppressive microenvironment, as evidenced by fewer CD8 T cells and more abundant regulatory T cells, which might result in worse long-term prognosis. Notably, we cannot exclude that Hedgehog pathway inhibition may also have direct effects on immune cells, as reported previously (61). Alternatively, deleterious effects associated with long-term Hedgehog pathway inhibition may be associated with the loss of well-differentiated PDAC and the increase in poorly differentiated PDAC that we observed following a 2-week LDE225 treatment, which is consistent with previous studies (22, 23). Overall, the effects of Hedgehog pathway inhibition on PDAC progression may not just be due to alterations in specific CAF subtypes, but how these alterations affect signaling within and between these cells and how specific signals integrate with other components of the tumor microenvironment. A deeper understanding of the biology and functions of distinct CAF subtypes, including studies examining tumor/CAF/immune cell cross-talk, could lead to future combinatorial therapies.
Authors' Disclosures
G. Biffi reports grants from Cancer Research UK and Human Frontier Science Program during the conduct of the study. Y. Zhang reports grants from NIH during the conduct of the study and outside the submitted work. M.A. Anderson reports other from GlaxoSmithKline, Boehringer Ingelheim, Boston Scientific, and Olympus outside the submitted work. A. Rao reports other from Voxel Analytics, LLC, Agilent Technologies, Genophyll, LLC, and Texas A&M IBT and grants from NIH and ACS outside the submitted work. D.A. Tuveson reports grants from NIH NCI, Lustgarten Foundation, and Simons Foundation during the conduct of the study. Dr. Tuveson also reports grants from ONO, Fibrogen, and Merck; other from Leap Therapeutics, Surface Oncology, and Cygnal Therapeutics; and grants and other from Mestag Therapeutics outside the submitted work, as well as has a patent as coinventor, “Hedgehog pathway inhibitors” filed by CRT/CRUK January 23, 2009 as US61/205,837 (Olive and colleagues, 2009) and PCT US2010/021816 filed January 22, 2010 issued to CRUK/CRT. B.L. Allen reports grants from NIH and University of Michigan during the conduct of the study. No disclosures were reported by the other authors.
Disclaimer
The funders had no role in study design, data collection and analysis, decision to publish, or preparation of the manuscript.
Authors' Contributions
N.G. Steele: Conceptualization, formal analysis, validation, investigation, writing–original draft, writing–review and editing. G. Biffi: Conceptualization, validation, investigation, writing–original draft, writing–review and editing. S.B. Kemp: Investigation. Y. Zhang: Investigation. D. Drouillard: Investigation. L. Syu: Investigation. Y. Hao: Formal analysis. T.E. Oni: Investigation, writing–review and editing. E. Brosnan: Investigation. E. Elyada: Investigation. A. Doshi: Investigation. C. Hansma: Formal analysis, investigation. C. Espinoza: Investigation. A. Abbas: Investigation. S. The: Investigation. V. Irizarry-Negron: Investigation. C.J. Halbrook: Investigation. N.E. Franks: Investigation. M.T. Hoffman: Investigation. K. Brown: Investigation. E.S. Carpenter: Investigation. Z.C. Nwosu: Formal analysis, investigation. C. Johnson: Formal analysis. F. Lima: Investigation. M.A. Anderson: Resources. Y. Park: Formal analysis. H.C. Crawford: Resources. C.A. Lyssiotis: Resources. T.L. Frankel: Resources, supervision. A. Rao: Formal analysis. F. Bednar: Resources, data curation, formal analysis, methodology, writing–review and editing. A.A. Dlugosz: Investigation, writing–review and editing. J.B. Preall: Resources, data curation, formal analysis, methodology, writing–review and editing. D.A. Tuveson: Conceptualization, resources, supervision, funding acquisition, investigation, writing–review and editing. B.L. Allen: Conceptualization, resources, formal analysis, supervision, funding acquisition, investigation, methodology, writing–original draft, writing–review and editing. M. Pasca di Magliano: Conceptualization, resources, formal analysis, investigation, writing–original draft, writing–review and editing.
Acknowledgments
The results shown here are, in part, based on data generated by The Cancer Genome Atlas Research Network: https://www.cancer.gov/tcga. This project was supported by NIH/NCI grants R01CA151588, R01CA198074, and U01CA224145, and the American Cancer Society (to M. Pasca di Magliano). This work was supported by the University of Michigan Cancer Center support grant (P30CA046592), including an Administrative Supplement (to H.C. Crawford and M. Pasca di Magliano). This work was supported by the NIH (R01 DC014428, R01 CA198074, and R01 118751 to B.L. Allen). Research reported in this article was supported by the University of Michigan Cancer Center Support grant (P30 CA046592) by the use of the following Cancer Center Shared Resource: Cell and Tissue Imaging. F. Bednar was funded by the Association of Academic Surgery Joel Roslyn Award. T.L. Frankel was funded by K08CA201581. Research reported in this article was supported by the NCI award number P30CA046592 by the use of the following Rogel Cancer Center Shared Resource: Transgenic Animal Models (to A.A. Dlugosz). This project was supported by NIH/NCI grants R01 CA118875 (to L. Syu), and P01 DK062041 and 5P30 CA046592 (to A.A. Dlugosz). S.B. Kemp was supported by T32 GM113900. N.G. Steele was supported by T32 CA009676 and is a recipient of the American Cancer Society Postdoctoral award PF-19-096-01 and the Michigan Institute for Clinical and Healthy Research Postdoctoral Translational Scholar Program fellowship award. E.S. Carpenter was supported by the American College of Gastroenterology Clinical Research award and by T32 DK094775. A. Rao and S. The were supported by institutional startup funds from the University of Michigan, a gift from Agilent Technologies, NCI grant R37 CA214955, and a Research Scholar grant from the American Cancer Society (RSG-16-005-01). C.J. Halbrook was supported by K99 CA241357 and P30 DK034933 NIH awards. The Tuveson laboratory was supported by the NIH Cancer Center Support grant P30 CA045508 and the Lustgarten Foundation, where D.A. Tuveson is a distinguished scholar and Director of the Lustgarten Foundation–designated Laboratory of Pancreatic Cancer Research. D.A. Tuveson was also supported by the Thompson Foundation, the Cold Spring Harbor Laboratory and Northwell Health Affiliation, the Northwell Health Tissue Donation Program, the Cold Spring Harbor Laboratory Association, and the NIH (NIH P30 CA45508, U01 CA210240, R01 CA229699, U01 CA224013, R01 CA188134, and R01 CA190092). This work was supported by a gift from the Simons Foundation (552716 to D.A. Tuveson). G. Biffi was a fellow of the Human Frontiers Science Program (LT000195/2015-L) and EMBO (ALTF 1203-2014) and was supported by a Cancer Research UK core funding (A27463) and by the Pancreatic Cancer and CMB Programmes of the Cancer Research UK Cambridge Centre. E. Elyada was a fellow of the Human Frontiers Science Program (LT000403/2014-L). J.B. Preall was supported by the Cold Spring Harbor Laboratory and Northwell Health Affiliation. Y. Park was supported by R50 CA211506. The authors would like to thank Tricia Tamsen and Judy Opp from the University of Michigan Advanced Genomics Core, and the Tissue Procurement Center at the University of Michigan. We would also like to thank Matthew Cochran and Terry Wightman at the University at the Rochester Medical Center Flow Cytometry Shared Resource Laboratory. We would like to thank Dr. Christ Wright for sharing the iKC (Ptf1a-CreERT; KrasLSL-G12D/+) mouse model. This work was performed with assistance from the University of Michigan Shared Resources: Biostatistics, Analytics & Bioinformatics; Flow Cytometry; Transgenic Animal Models; Tissue and Molecular Pathology; Structure & Drug Screening; Cell & Tissue Imaging; Experimental Irradiation; Preclinical Imaging & Computational Analysis; Health Communications; Immune Monitoring; and Pharmacokinetics. This work was performed with assistance from the Cold Spring Harbor Laboratory shared resources, which are supported by the NIH Cancer Center Support Grant P30 CA045508: Bioinformatics, Flow Cytometry, Animal, and Cell and Tissue Imaging Shared Resources.
The costs of publication of this article were defrayed in part by the payment of page charges. This article must therefore be hereby marked advertisement in accordance with 18 U.S.C. Section 1734 solely to indicate this fact.