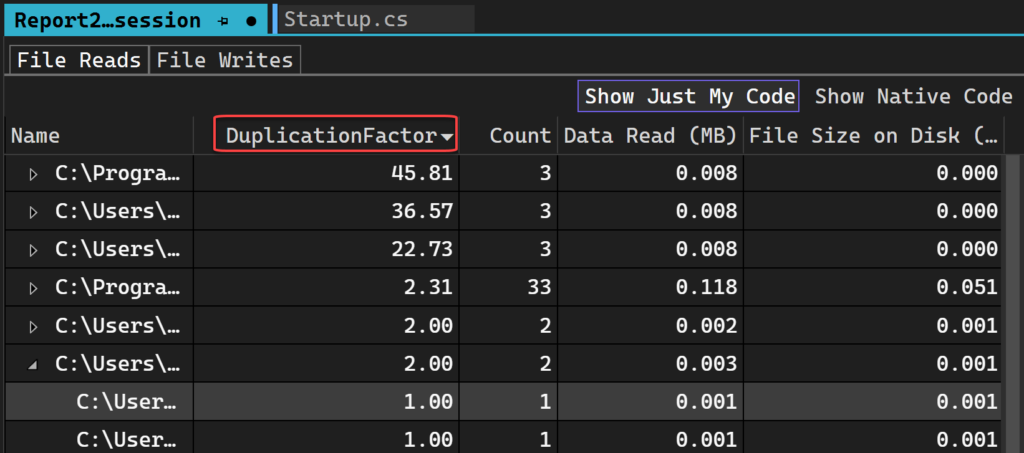
Introducing the new File I/O tool
We just launched a new profiling tool in Visual Studio 17.2 that helps you understand how you can optimize your File I/O operations to improve performance in your apps. If you’re trying to investigate and diagnose slow loading times, the new File IO tool can help you understand how the I/O operations ...
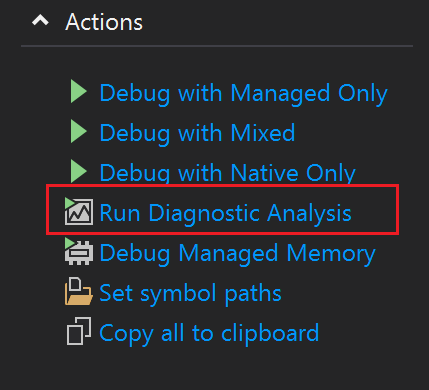
With the release of Visual Studio 2019 16.9 you can try out our new managed memory dump analyzers to help you root cause the issues that plague your applications in production. We're excited for you to give it a try!
With the release of version 16.9 of Visual Studio, instrumentation profiling in Visual Studio just got better. Introducing our new dynamic instrumentation tool. This tool shows the exact number of times your functions are called and is faster than our previous static instrumentation tool. It also supports .NET Core instrumentation without...
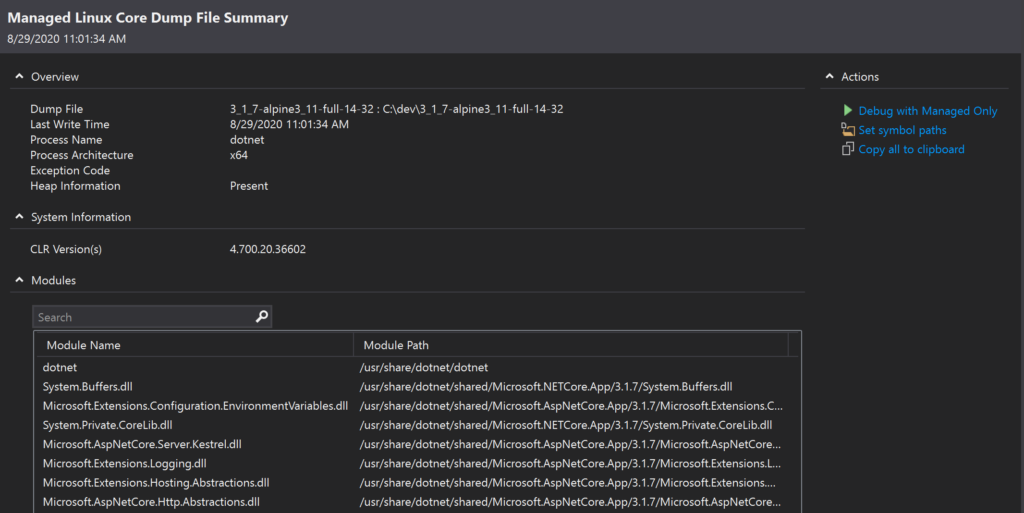
With the release of Visual Studio 16.8 Preview 3 you now have the ability to open and analyze managed dumps collected on Linux and use the best in class debugging tools available in Visual Studio.
If you are focused on squeezing out the last bits of performance for your .NET service or application, you might choose to take advantage of JIT compiler optimizations. However, debugging optimized code can be a challenge. In this blog I’ll show you how the Disassembly Window can help you debug optimized code.
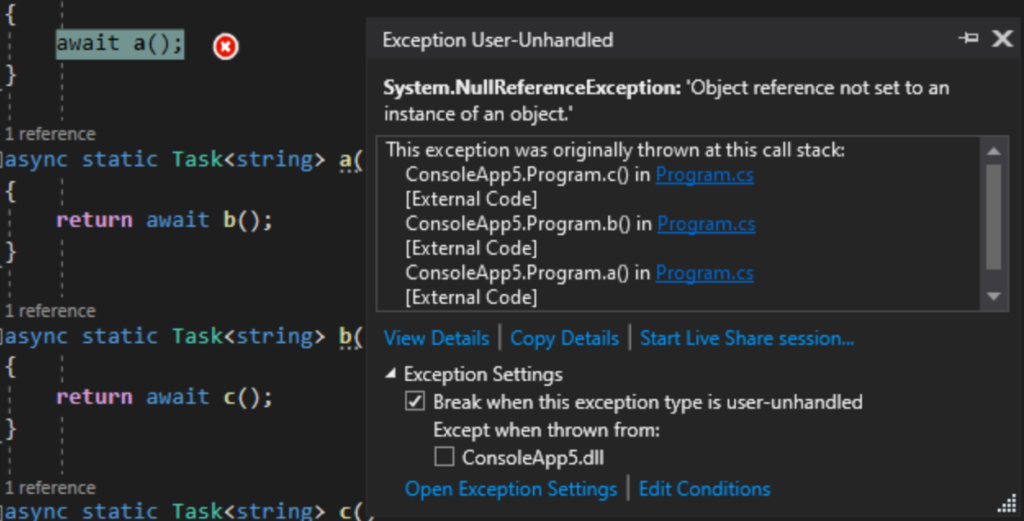
Ever had a bug in an async method that caused an exception? Been frustrated that the debugger doesn't show you where that exception happened? Or been frustrated when looking at an exception that has an inner exception, but the debugger doesn't easily show you where that exception was from? Starting from the Visual Studio 2019 16.5 release, the...
When unexpected crashes occur in your managed application you are often left with little evidence of the issue; capturing and analyzing memory dumps may be your last best option. Thankfully Visual Studio is a great tool for analyzing your apps memory dumps! In this post we show you how easy it can be to resolve the issue using Visual Studio.
Snapshot Debugger is built for production so you can set Snappoints and Logpoints in code, like debugger breakpoints and tracepoints. However, when a Snappoint is hit in an AKS Linux Docker container, a snapshot is dynamically created without stopping the process. You are then able to attach to these snapshots using Visual Studio.


 Light
Light Dark
Dark