The first Preview for Visual Studio 2022 17.6 is now available! This release expands on the recently released 17.5 version of Visual Studio and aims at enhancing your productivity whether you’re a .NET developer, a game developer, and/or a C++ developer.
Why should you try the latest preview? Because it’s like living in the future – ...
Validating encoded strings is a basic but important part of our debugging workflow these days. I cannot count the number of times I have found myself looking at a URL-encoded string only to be suddenly unsure how percentage signs are supposed to be represented?
I have been a web developer for years, but I can never remember what the URL-...
If you’re like me, you’ve probably searched through Debug.Log messages in the Unity console to find or fix a bug. Have you also asked if there was a better way? Follow along with our new video series and by the end we think you’ll be surprised at how a few simple debugging tools in Visual Studio can transform your workflow with Unity.
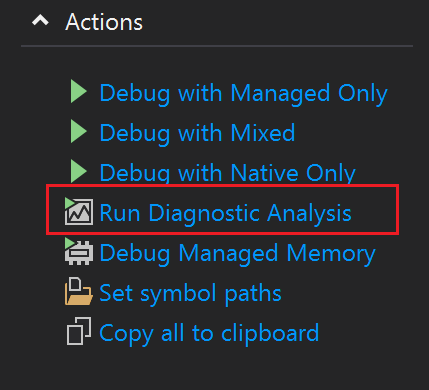
With the release of Visual Studio 2019 16.9 you can try out our new managed memory dump analyzers to help you root cause the issues that plague your applications in production. We're excited for you to give it a try!
If you are focused on squeezing out the last bits of performance for your .NET service or application, you might choose to take advantage of JIT compiler optimizations. However, debugging optimized code can be a challenge. In this blog I’ll show you how the Disassembly Window can help you debug optimized code.
Want to quickly identify objects by more than just their type while debugging? You can now pin object properties to the top of your debugger displays using the new Pinnable Properties tool in Visual Studio 2019 16.4!
Welcome to the October update of Java on Visual Studio Code! This month, we're bringing some new features for code navigation, code actions and refactoring, code snippet along with Java 13 support. There's also improvements in debugger, maven, checkstyle and Test Runner.
September update for Java on Visual Studio Code. Including move refactoring, more code actions, live linting, new getting started experience and more updates for debugger and test runner extensions.
When unexpected crashes occur in your managed application you are often left with little evidence of the issue; capturing and analyzing memory dumps may be your last best option. Thankfully Visual Studio is a great tool for analyzing your apps memory dumps! In this post we show you how easy it can be to resolve the issue using Visual Studio.
Welcome to the June update of Java on Visual Studio Code!
Earlier this month, we shared our new Java Installer for Visual Studio Code, which aims to help new Java developers to get their environment ready and start coding in just a few clicks. In this update, we’d like to share a couple new features and enhancements delivered during last ...


 Light
Light Dark
Dark