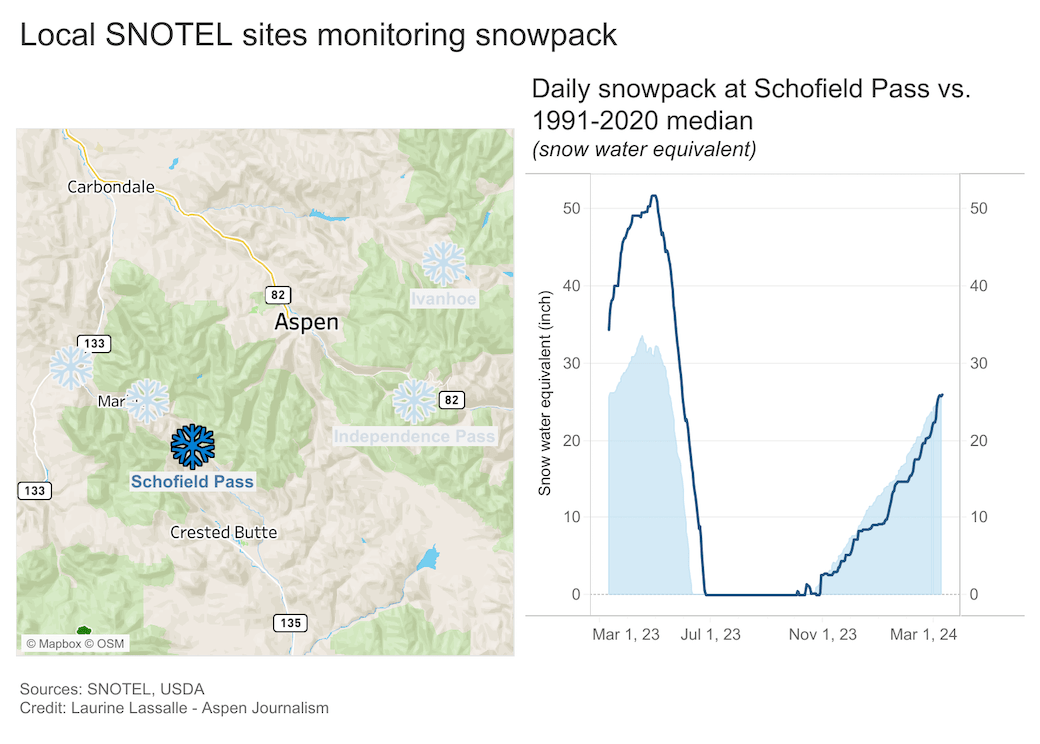
• Snowpack at Indy Pass and McClure Pass reaches 100% and 82% of normal, respectively, on March 24.
• Lake Powell was 33.3% full on March 24, down from 33.5% last week.
• High air temperatures at ASE went up to 53°F on March 22.
Category: Local Public Data
Data dashboard: Three-quarters of the rooms in Aspen and Snowmass were booked in February
• February occupancy for Aspen and Snowmass combined reached 75.9%, down from 76.9% last year, but 7% more rooms were booked due to increased inventory.
• Snowpack in the Roaring Fork basin reached 110% of median on March 17.
• Lake Powell’s elevation has lost about 7 inches since last week.
Data dashboard: Local snowpack up after last week’s storm
• Snowpack in the Roaring Fork basin reached an average of 15.1 inches of snow-water equivalent per site on March 10, or 109% of median. That’s up from 13.4 inches on March 3 and from 100% of median.
• Lake Powell was 33.7% full on March 10, down from 33.9% last week.
• Low air temperatures at ASE reached -7 on Feb. 28 before going back up to 23°F on March 2.
Data dashboard: Lake Powell’s water levels down, Roaring Fork snowpack is up
• Snowpack in the Roaring Fork basin reached an average of 13.4 inches of snow-water equivalent per site on March 3, or 100% of median. That’s up from 12.2 inches on Feb. 25 and from 96% of median.
• Lake Powell’s elevation reached 3,561.7 feet on March 3, down from 3,562.6 feet on Feb. 25.
• Air temperatures at ASE kept swinging and dropped as low as 2°F on Feb. 27.
Data dashboard: Swinging air temperatures
• Snowpack in the Roaring Fork basin reached an average of 12.2 inches of snow-water equivalent per site on Feb. 25, or 96% of median.
• Lake Powell was 34.2% full on Feb. 25, down from 34.4% last week.
• High air temperatures at the Aspen airport went from 48°F on Feb. 6 to 29°F on Feb. 11 before going up to 47°F on Feb. 19 and dropping to 36°F on Feb. 22.
Data dashboard: January occupancy influenced by global economy
Paid occupancy in Aspen reached 69.3% in January, down from 79.3% last year. Meanwhile, Snowmass recorded 72% paid occupancy, down from 2023’s 73.1%.
Snowpack at Schofield Pass reached 19.5 inches of snow-water equivalent on Feb. 18, up from 17.6 inches last week.
Lake Powell was 34.4% full on Feb. 18, down from 34.6% last week but up from 23% a year ago.
Data dashboard: Roaring Fork basin snowpack still close to normal
• Snowpack at Schofield Pass reached 17.6 inches of snow-water equivalent, or 89% of median on Feb. 11.
• Lake Powell was 34.6% full on Feb. 11, down from 34.8% last week.
• High air temperatures at ASE went as high as 48°F on Jan. 31 and as low as 30°F on Feb. 3.
Data dashboard: Weekend winter storm boosts snowpack
• Snowpack at Indy Pass increased from 7.8 inches of snow-water equivalent on Feb. 2 to 9.1 inches on Feb. 4 after a snowstorm hit the mountains over the weekend.
• Lake Powell was 34.8% full on Feb. 4, down from 35% last week.
• High temperatures at ASE went from 34°F on Jan. 26 to 42°F on Jan. 28.
Pitkin County moving to place a cap on exterior energy use
The Pitkin County Board of County Commissioners (BOCC) on Dec. 6 approved on first reading a package of code amendments that place a cap on exterior energy use at 200 million British thermal units (Btu) per year and per parcel and implement new “electric-ready” requirements.
Data dashboard: Lake Powell’s water levels are slowing dropping but remain higher than last year
• Snowpack in the Roaring Fork basin reached an average of 9 inches of snow-water equivalent per site on Jan. 28, or 100% of median. That’s the same as last week.
• Lake Powell was 35% full on Jan. 28, down from 35.25% last week but up from last year’s 23.46%.
• High air temperatures at the Aspen airport went from 26°F on Jan. 17 to 42°F on Jan 21 before going down to 39°F on Jan. 24, which is about 4 degrees above normal.