


Thyroid hormone (TH) signaling promotes tissue maturation and adult organ formation. Developmental transitions alter an organism's metabolic requirements, and it remains unclear how development and metabolic demands are coordinated. We used the zebrafish as a model to test whether and how TH signaling affects pancreatic islet maturation, and consequently glucose homeostasis, during the larval to juvenile transition. We found that exogenous TH precociously activates the β-cell differentiation genes pax6b and mnx1 while downregulating arxa, a master regulator of α-cell development and function. Together, these effects induced hypoglycemia, at least in part by increasing insulin and decreasing glucagon expression. We visualized TH target tissues using a novel TH-responsive reporter line and found that both α- and β-cells become targets of endogenous TH signaling during the larval-to-juvenile transition. Importantly, endogenous TH is required during this transition for the functional maturation of α- and β-cells in order to maintain glucose homeostasis. Thus, our study sheds new light on the regulation of glucose metabolism during major developmental transitions.
Introduction
Organ development often involves a two-step process: the formation of a functionally immature organ during embryogenesis followed by maturation into the adult form. This second step most often takes place during the postembryonic/postnatal developmental period, when plasma thyroid hormone (TH) concentrations are high. In rodents, these major developmental changes occur during the suckling-to-weaning transition, and their digestive organs undergo functional and morphological changes during this period (1), correlating with the dietary switch from mother’s milk to solid foods. It has been proposed that Xenopus metamorphosis and the zebrafish (Danio rerio) larval-juvenile transition are functionally equivalent to mammalian weaning, based on cellular and molecular events in their digestive organs during these periods (2–7).
The pancreas is an organ in the digestive system that undergoes morphological and functional changes during the suckling-to-weaning transition. For example, the weight of the rat pancreas increases five- to sixfold during this period (8). In addition, pancreatic acinar cells become functionally mature and start to secrete the full suite of digestive enzymes, including trypsin and amylase, into the duodenum during the weaning period (1). In the endocrine pancreas, β-cell mass increases (8), and more organized, functional islets appear during this period (8–13) as β-cells acquire the ability to secrete insulin in response to glucose around the second week after birth (9). β-Cell secretory functions continue to improve well beyond weaning periods (9), although the underlying mechanisms are not well understood.
The TH T3 (triiodothyronine) signals through the nuclear TH receptor (THR). THR functions as a transcriptional repressor in the absence of TH and a transcriptional activator in the presence of TH. It has been reported that ligand-bound THR can directly activate Mafa expression and that exogenous TH can induce MafA-dependent glucose-responsive insulin secretion in the rat pancreas (14). Furthermore, TH is used in the most effective protocols developed to date to generate glucose-responsive insulin-secreting cells from pluripotent cells (15,16). These data implicate TH signaling in β-cell maturation. Furthermore, TH can also induce endocrine cell differentiation from ductal cells in E12.5 mouse pancreatic explants (17) and stimulate acinar cell proliferation in the adult mouse (18). It has therefore been hypothesized that TH regulates multiple aspects of pancreas development, including endocrine cell differentiation, β-cell maturation, and the size of the exocrine compartment. However, it remains unclear exactly when and where TH signaling is activated during pancreas development.
The zebrafish (D. rerio) has emerged as a powerful model to study mechanisms of pancreas development and β-cell differentiation. Zebrafish pancreatic development is similar to that in mammals in terms of cellular events and molecular pathways (19–21). For example, in zebrafish, bilateral pdx1-positive pancreatic primordia appear by 14 h postfertilization (hpf), and the dorsal bud emerges from these primordia by 22 hpf. At 40 hpf, the ventral bud is visible, and by 52 hpf, it has fused with the dorsal bud; the principal islet, originally derived from the dorsal bud, is organized like a mammalian islet, with α- and δ-cells surrounding a β-cell core. Here, we investigated the spatiotemporal regulation of TH signaling during zebrafish pancreatic development, focusing on the endocrine lineages. We show that TH stimulates insulin expression through upregulation of pax6b and mnx1. In addition, we found that TH inhibits the expression of both glucagon paralogs by upregulating pax4 expression and downregulating arxa expression. Together, these effects, at least in part, decrease glucose levels in zebrafish larvae. To visualize TH target tissues, we generated a TH reporter line and found that both α- and β-cells are direct targets of TH signaling during and after the larval-juvenile transition. Additionally, using a hypothyroid zebrafish model, we found that TH can regulate glucose homeostasis by modulating the expression of endocrine genes during the larval-juvenile transition. In adults, TH continues to regulate α- and β-cell function as well as glucose homeostasis. These results indicate that TH signaling is involved in the development and maturation of α- and β-cells during postembryonic development and that it maintains glucose homeostasis, at least in part, by modulating the insulin-to-glucagon ratio throughout the vertebrate life cycle.
Research Design and Methods
Zebrafish Lines
All zebrafish husbandry was performed under standard conditions in accordance with institutional and national ethical and animal welfare guidelines. A 1,000× stock solution of 10 μmol/L T3 in 5 mmol/L NaOH was made and stored at –20°C until use. Larvae were treated with the indicated concentration of T3 in egg water for the indicated number of days at 28°C. Larvae incubated in 5 μmol/L NaOH egg water were used as controls. For adult zebrafish, 10 μL of 10 nmol/L T3 was injected intraperitoneally once a day for three consecutive days. NaOH (10 μL of 7 μmol/L) in egg water was used for control injections.
We used the following transgenic lines: Tg(ins:Luc2;cryaa:mCherry)gi3, abbreviated ins:Luc2; Tg(ins:H2BGFP;ins:dsRED)s960 (22), abbreviated ins:H2BGFP; Tg(−4.0ins:eGFP)Zf5 (23), abbreviated ins:eGFP; Tg(gcga:eGFP)ia1 (24), abbreviated gcga:eGFP; Tg(P0-pax6b:eGFP)ulg515 (25), abbreviated pax6b:eGFP; TgBAC(neurod1:eGFP)nl1 (26), abbreviated neurod1:eGFP; Tg(−2.6mnx1:GFP)ml59 (27), abbreviated mnx1:eGFP; and Tg(tg:nVenus-2a-nfsB)wp.rt8 (28), abbreviated tg:nVenus-2a-nfsB.
Nitroreductase-Mediated Cell Ablation
To ablate the thyroid follicles of tg:nVenus-2a-nfsB fish, we incubated 20 days postfertilization (dpf) larvae for 48 h in 10 mmol/L metronidazole (Mtz) with 1% DMSO or 1% DMSO alone as a control. Thyroid ablations of adult fish were performed on transgenic fish injected intraperitoneally with 15 μL of 30 mmol/L Mtz or DMSO as a control.
Results
T3 Stimulates ins Promoter Activity, Reduces Glucose Levels, and Improves Glucose Tolerance
For determination of the effect of TH on pancreatic preproinsulin expression, transgenic ins:luciferase2 [Tg(ins:Lyc2;cryaa:mCherry)gi3] larvae were treated with T3 from 4 to 7 dpf (Fig. 1A and B). T3 significantly increased ins-promoter activity at 10 nmol/L but showed no significant effects at 0.1, 1, or 100 nmol/L (Fig. 1B). Glucose levels were reciprocally reduced in a T3 dose–dependent manner (Fig. 1C). During the 4- to 7-day developmental window, 10 nmol/L T3 was the optimal concentration for activation of ins expression and glucose reduction. For further definition of when T3 acts, larvae were treated with 10 nmol/L T3 starting at 4 dpf and ins-promoter activity and glucose levels were analyzed at 5, 6, 7, and 8 dpf (Fig. 1D). ins-promoter activity was enhanced at 7 and 8 dpf (Fig. 1E), while glucose levels were reduced at 6, 7, and 8 dpf (Fig. 1F). These results indicate that ins expression is T3 responsive by 7 dpf and that our 4–7 dpf treatment conditions induce a hypoglycemic phenotype.

T3 stimulates ins expression, reduces glucose levels, and improves glucose tolerance. A–C: Zebrafish were treated with 0, 0.1, 1, 10, or 100 nmol/L T3 from 4 to 7 dpf and analyzed at 7 dpf for ins-promoter activity (B) and for glucose levels (C). Note that ins-promoter activity was significantly enhanced by 10 nmol/L T3 treatments and that glucose levels were reduced by 10 and 100 nmol/L T3 treatments. D–F: Zebrafish were treated with 10 nmol/L T3 from 4 dpf and analyzed for ins-promoter activity (E) and glucose levels (F) at 5, 6, 7, and 8 dpf. Note that ins-promoter activity was enhanced at 7 and 8 dpf by T3 treatment (E) and that glucose levels were reduced at 6, 7, and 8 dpf by T3 treatment (F). G and H: Larvae were first treated with 10 nmol/L T3 from 4 to 7 dpf and then with 5% glucose for 1 h and finally analyzed for glucose levels. Glucose tolerance was compared between T3 treatment and no T3 treatment (H). Values of bioluminescence signal were derived from 5 wells per condition, with 3 animals per well. Values of glucose were derived from 5 wells per condition, with extracts from 20 animals per well. *P < 0.05, **P < 0.01 compared with controls by Tukey-Kramer honest significant difference test after ANOVA. AU, arbitrary units; hr, hour; ns, not significant.
T3 stimulates ins expression, reduces glucose levels, and improves glucose tolerance. A–C: Zebrafish were treated with 0, 0.1, 1, 10, or 100 nmol/L T3 from 4 to 7 dpf and analyzed at 7 dpf for ins-promoter activity (B) and for glucose levels (C). Note that ins-promoter activity was significantly enhanced by 10 nmol/L T3 treatments and that glucose levels were reduced by 10 and 100 nmol/L T3 treatments. D–F: Zebrafish were treated with 10 nmol/L T3 from 4 dpf and analyzed for ins-promoter activity (E) and glucose levels (F) at 5, 6, 7, and 8 dpf. Note that ins-promoter activity was enhanced at 7 and 8 dpf by T3 treatment (E) and that glucose levels were reduced at 6, 7, and 8 dpf by T3 treatment (F). G and H: Larvae were first treated with 10 nmol/L T3 from 4 to 7 dpf and then with 5% glucose for 1 h and finally analyzed for glucose levels. Glucose tolerance was compared between T3 treatment and no T3 treatment (H). Values of bioluminescence signal were derived from 5 wells per condition, with 3 animals per well. Values of glucose were derived from 5 wells per condition, with extracts from 20 animals per well. *P < 0.05, **P < 0.01 compared with controls by Tukey-Kramer honest significant difference test after ANOVA. AU, arbitrary units; hr, hour; ns, not significant.
Given the correlation between ins upregulation and glucose reduction in these experiments, we next tested glucose tolerance in T3-treated larvae. At 7 dpf, after 3 days of T3 treatment, larvae were exposed to glucose for 60 mins and glucose levels were analyzed at 0, 30, 60, and 90 mins after glucose treatment (Fig. 1G). Glucose levels were unaltered in T3-treated larvae immediately after the glucose challenge (0 min). Strikingly, at 30, 60, and 90 mins after the challenge, glucose levels were lower in T3-treated larvae compared with nontreated controls (Fig. 1H). These data indicate that T3 increases the glucose disposal capacity of zebrafish larvae.
T3 Stimulates ins Expression but Does Not Alter β-Cell Number
Given that TH stimulated ins promoter activity in ins:Luc2 lines, we next tested whether TH stimulates endogenous ins expression using qPCR. Zebrafish have two insulin genes, preproinsulin and preproinsulin b. We focused our analysis on ins because insb expression is minimal after 2 dpf. With T3 treatment started at 4 dpf, ins expression was analyzed at 5, 6, and 7 dpf. Although T3 did not significantly affect endogenous ins expression at 5 and 6 dpf, enhanced ins expression was observed at 7 dpf (Fig. 2A). Next, we analyzed whether TH alters the endogenous ins expression pattern using in situ hybridization. Zebrafish larvae were treated with T3 from 4 dpf and analyzed at 7 dpf. T3 did not induce ectopic ins expression (Fig. 2B and C). Furthermore, using a similar treatment strategy with ins:eGFP reporter fish, we did not observe eGFP expression outside the pancreas (Fig. 2D and E). Notably, T3 increased ins:eGFP expression intensity in the principal islet compared with controls (Fig. 2F–H). To determine whether an expanded β-cell mass contributed to the increased ins expression in T3-treated larvae, we used a nuclear localized ins:H2BGFP reporter to quantify β-cell number. Interestingly, T3 did not alter the number of β-cells (Fig. 2I–K). Taken together, these data suggest that T3 treatments of zebrafish larvae enhance ins expression without increasing β-cell number in zebrafish.

T3 enhances ins expression levels but does not change ins expression pattern or β-cell numbers. A: Expression of ins mRNA was compared between control and T3-treated larvae by qPCR. Endogenous ins expression was enhanced after 3 days of T3 treatment (7 dpf). B and C: Expression pattern of ins was compared between control (B) and T3-treated (C) larvae at 7 dpf by in situ hybridization. ins expression was detected only in pancreatic β-cells (arrow), but not in other tissues, in control (B) and T3-treated (C) larvae. D–H: Tg(ins:eGFP) animals were treated with 10 nmol/L T3 starting at 4 dpf and analyzed at 7 dpf. eGFP expression mimicked the endogenous ins expression pattern in control (D) and T3-treated (E) larvae. However, eGFP intensity was enhanced after T3 treatment (D–H). Green arrows point to eGFP-positive cells in the islet. I–K: Tg(ins:H2BGFP) animals were treated with 10 nmol/L T3 starting at 4 dpf and analyzed at 7 dpf. Note that the β-cell number did not change with T3 treatment (K). Scale bars in B–E, 200 μm; scale bars in F, G, I, and J, 10 μm. *P < 0.05 compared with controls by Tukey-Kramer honest significant difference test after two-way ANOVA in A. *P < 0.05 compared with controls by Student t test in H and K. ns, not significant.
T3 enhances ins expression levels but does not change ins expression pattern or β-cell numbers. A: Expression of ins mRNA was compared between control and T3-treated larvae by qPCR. Endogenous ins expression was enhanced after 3 days of T3 treatment (7 dpf). B and C: Expression pattern of ins was compared between control (B) and T3-treated (C) larvae at 7 dpf by in situ hybridization. ins expression was detected only in pancreatic β-cells (arrow), but not in other tissues, in control (B) and T3-treated (C) larvae. D–H: Tg(ins:eGFP) animals were treated with 10 nmol/L T3 starting at 4 dpf and analyzed at 7 dpf. eGFP expression mimicked the endogenous ins expression pattern in control (D) and T3-treated (E) larvae. However, eGFP intensity was enhanced after T3 treatment (D–H). Green arrows point to eGFP-positive cells in the islet. I–K: Tg(ins:H2BGFP) animals were treated with 10 nmol/L T3 starting at 4 dpf and analyzed at 7 dpf. Note that the β-cell number did not change with T3 treatment (K). Scale bars in B–E, 200 μm; scale bars in F, G, I, and J, 10 μm. *P < 0.05 compared with controls by Tukey-Kramer honest significant difference test after two-way ANOVA in A. *P < 0.05 compared with controls by Student t test in H and K. ns, not significant.
T3 Represses gcg Expression and Reduces α-Cell Number
As glucose homeostasis is also under the control of glucagon secreted from pancreatic α-cells, we investigated whether TH signaling regulates α-cell function. We treated wild-type larvae with T3 starting at 4 dpf and analyzed the expression levels of glucagon a and glucagon b at 5, 6, and 7 dpf by quantitative PCR (qPCR). T3 significantly repressed the expression of both gcga and gcgb at 5, 6, and 7 dpf (Fig. 3A). We next treated larvae with T3 starting at 4 dpf and investigated its effect on the expression pattern of gcga and gcgb at 7 dpf by in situ hybridization. T3 treatment reduced gcga and gcgb expression in pancreatic islets (Fig. 3B), and no ectopic expression was observed (Fig. 3B and data not shown). Consistent with the effect on endogenous gcga expression, T3 suppressed the expression of the gcga:eGFP transcriptional reporter (Fig. 3C). Interestingly, the number of gcga:eGFP-positive α-cells was modestly reduced in T3-treated larvae (26 ± 2 in controls and 21 ± 2 in T3 treated [Fig. 3E]). Thus, TH impairs α-cell differentiation and/or proliferation in addition to negatively regulating gcg expression.

T3 represses gcg expression. A: Expression of gcga and gcgb mRNA was compared between T3 treatment and no T3 treatment by qPCR. The expression of gcga and gcgb was reduced at 5, 6, and 7 dpf by T3 treatment. B: Expression patterns of gcga and gcgb were compared after treatment with and without T3 by in situ hybridization. Both gcga and gcgb expression levels appeared to be reduced after T3 treatment. Arrows point to glucagon-positive cells in the islet. C and D: Tg(gcga:eGFP) animals were treated with 10 nmol/L T3 starting at 4 dpf, and the eGFP expression levels in the islets were analyzed at 7 dpf. Note that eGFP intensity was decreased after T3 treatment (D). E: Tg(gcga:eGFP)-positive cell number was compared after treatment with and without T3. Note that the α-cell number was decreased after T3 treatment. Scale bar in B, 100 μm; scale bar in C, 10 μm. *P < 0.05 compared with control by Tukey-Kramer honest significant difference test after two-way ANOVA in A and by Student t test in D. **P < 0.01 compared with control by Student t test in E.
T3 represses gcg expression. A: Expression of gcga and gcgb mRNA was compared between T3 treatment and no T3 treatment by qPCR. The expression of gcga and gcgb was reduced at 5, 6, and 7 dpf by T3 treatment. B: Expression patterns of gcga and gcgb were compared after treatment with and without T3 by in situ hybridization. Both gcga and gcgb expression levels appeared to be reduced after T3 treatment. Arrows point to glucagon-positive cells in the islet. C and D: Tg(gcga:eGFP) animals were treated with 10 nmol/L T3 starting at 4 dpf, and the eGFP expression levels in the islets were analyzed at 7 dpf. Note that eGFP intensity was decreased after T3 treatment (D). E: Tg(gcga:eGFP)-positive cell number was compared after treatment with and without T3. Note that the α-cell number was decreased after T3 treatment. Scale bar in B, 100 μm; scale bar in C, 10 μm. *P < 0.05 compared with control by Tukey-Kramer honest significant difference test after two-way ANOVA in A and by Student t test in D. **P < 0.01 compared with control by Student t test in E.
To determine whether the reduction in gcg expression was caused by negative feedback from elevated paracrine Ins signaling upon T3 treatment, we generated insulin (ins, previously known as insa) mutants using CRISPR/Cas9-mediated genome editing. ins−/− larvae exhibit a complete absence of detectable Ins protein in their pancreatic islet (data not shown), and although they appear to develop apparently normally during early stages, mutant animals die by ∼10–11 dpf owing to metabolic defects (data not shown). We treated ins−/− larvae with T3 at 4 dpf and analyzed gcga and gcgb expression levels by qPCR at 6 dpf. Both gcga and gcgb expression were reduced after T3 treatment (Supplementary Fig. 1). These results indicate that T3 represses gcg expression through an Ins-independent pathway.
T3 Stimulates pax6b, mnx1, and pax4 Expression and Represses arxa Expression
To understand how T3 regulates pancreatic islet expression of ins, gcga, and gcgb, we investigated the effects of T3 treatment on upstream endocrine transcription factor genes. We used transcriptional eGFP reporters for pax6b, neurod1, and mnx1, which encode known regulators of endocrine differentiation and/or maturation (Fig. 4A–F). T3 treatment increased eGFP intensity of the pax6b and mnx1, but not of the neurod1, reporter transgenes within the principal islet (Fig. 4A–F). Furthermore, qPCR analysis revealed that T3 treatment upregulated endogenous expression of pax6b, mnx1, and pax4 and downregulated expression of arxa (Fig. 4G).

T3 modulates the expression of endocrine differentiation markers. A–F: Tg(pax6b:eGFP) (A and B), Tg(neurod1:eGFP) (C and D), and Tg(mnx1:eGFP) (E and F) animals were treated with T3 to investigate its effect on three genes (pax6b, neurod1, and mnx1) involved in endocrine cell differentiation. Note that eGFP intensities were enhanced in Tg(pax6b:eGFP) and in Tg(mnx1:eGFP) animals but not in Tg(neurod1:eGFP) animals after T3 treatment. G: qPCR analysis showed that T3 treatment enhances the expression of pax6b, mnx1, and pax4 and reduces the expression of arxa at 6 dpf. Scale bars, 10 μm. *P < 0.05, **P < 0.01 compared with controls by Student t test. ns, not significant.
T3 modulates the expression of endocrine differentiation markers. A–F: Tg(pax6b:eGFP) (A and B), Tg(neurod1:eGFP) (C and D), and Tg(mnx1:eGFP) (E and F) animals were treated with T3 to investigate its effect on three genes (pax6b, neurod1, and mnx1) involved in endocrine cell differentiation. Note that eGFP intensities were enhanced in Tg(pax6b:eGFP) and in Tg(mnx1:eGFP) animals but not in Tg(neurod1:eGFP) animals after T3 treatment. G: qPCR analysis showed that T3 treatment enhances the expression of pax6b, mnx1, and pax4 and reduces the expression of arxa at 6 dpf. Scale bars, 10 μm. *P < 0.05, **P < 0.01 compared with controls by Student t test. ns, not significant.
Pancreatic α- and β-Cells Are Targets of TH During and After Larval Development
We have shown that supplemental T3 stimulated ins expression and repressed gcg expression, leading to reduced glucose levels. We next asked whether and when endogenous T3 signaling was activated in pancreatic α- and β-cells. To address this question, we generated a TH-responsive zebrafish line to visualize T3 target tissues in vivo. The biological effects of T3 are mediated by signaling through THRs, which bind to TH-response elements (TRE) to regulate downstream target genes. Three copies of Xenopus laevis THbzipTREs (6xTRE) were inserted upstream of candidate minimal promoters driving eGFP to visualize TH signaling (Supplementary Fig. 2A). For identification of the optimal configuration, four different minimal promoters (cfos, bglob1, tk, and Pmini) were tested by transient injection assay for their response to T3 treatment (Supplementary Fig. 2B). The construct incorporating the bglob1 minimal promoter showed the highest proportion of eGFP-positive embryos after T3 treatment (Supplementary Fig. 2C and D). Next, we confirmed that T3 responsiveness was mediated by the TREs. We compared 6xTRE with bglob1:eGFP plasmids lacking TREs, containing 2xTREs, or containing mutant TREs that cannot bind THR [6xTREs(mut)] (Supplementary Fig. 2E), and found that intact TREs were essential for the T3-dependent stimulation of 6xTRE-bglob1:eGFP expression (Supplementary Fig. 2F).
A stable transgenic 6xTRE-bglob1:eGFP reporter was used to identify cells responsive to endogenous TH in the pancreas (Fig. 5A). First, to validate the reporter, we confirmed that exogenous T3 induced ubiquitous eGFP expression during larval stages (Supplementary Fig. 3A, D, and E). Before 20 dpf (Fig. 5B and F), including early larval stages (Supplementary Fig. 3B and C), eGFP-positive cells were not detected in the pancreas (Supplementary Fig. 3C). By 25 dpf, eGFP expression was detected in 71% of Ins-positive cells (Fig. 5C and F [white arrows]) but only 0.7% of Gcg-positive cells (red arrows). By 30 dpf, eGFP expression was also observed in 86% of Gcg-positive cells (Fig. 5D and F). In the adult pancreas, TH reporter expression was observed in 89% of Ins- and 95% of Gcg-positive cells (Fig. 5E and F). These results indicate that endogenous TH signaling is active during and after the larval-juvenile transition in differentiated α- and β-cells.
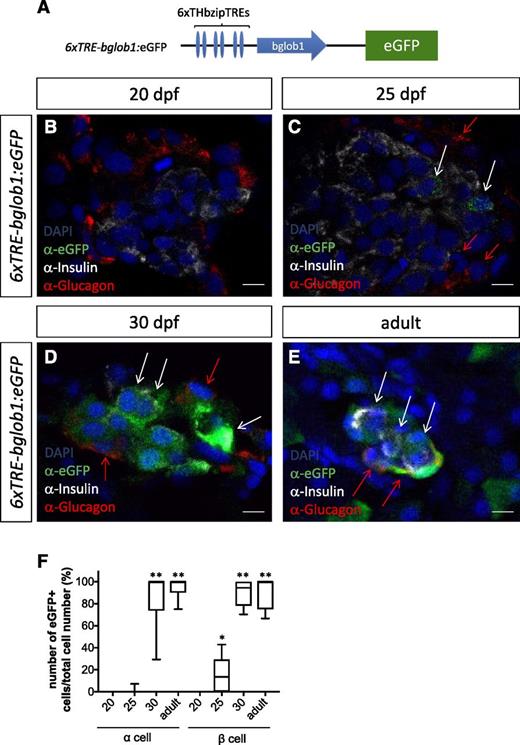
Pancreatic α- and β-cells are targets of TH signaling during and after larval development. A: Schematic diagram of TH reporter construct. B–E: TH reporter expression was compared with Gcg and Ins expression in islets at 20 (B), 25 (C), and 30 (D) dpf and in adults (E) by immunohistochemistry. Note that strong eGFP signal could be detected in both Gcg-positive (red arrows) and Ins-positive (white arrows) cells at 30 dpf and in adults. Weak eGFP signal in Ins-positive cells, but not in Gcg-positive cells, was also present at 25 dpf (white arrows). F: Ratio of TRE:eGFP-positive cells to Gcg-positive cells as well as Ins-positive cells. Values were derived from 5 fish per developmental time point, with a minimum of 3 sections per fish. Scale bars, 5 μm. *P < 0.05, **P < 0.01 compared with 20 dpf by Tukey-Kramer honest significant difference test after ANOVA.
Pancreatic α- and β-cells are targets of TH signaling during and after larval development. A: Schematic diagram of TH reporter construct. B–E: TH reporter expression was compared with Gcg and Ins expression in islets at 20 (B), 25 (C), and 30 (D) dpf and in adults (E) by immunohistochemistry. Note that strong eGFP signal could be detected in both Gcg-positive (red arrows) and Ins-positive (white arrows) cells at 30 dpf and in adults. Weak eGFP signal in Ins-positive cells, but not in Gcg-positive cells, was also present at 25 dpf (white arrows). F: Ratio of TRE:eGFP-positive cells to Gcg-positive cells as well as Ins-positive cells. Values were derived from 5 fish per developmental time point, with a minimum of 3 sections per fish. Scale bars, 5 μm. *P < 0.05, **P < 0.01 compared with 20 dpf by Tukey-Kramer honest significant difference test after ANOVA.
TH Regulates Glucose Metabolism by Stimulating ins Expression and Suppressing gcg Expression During the Larval-Juvenile Transition
Analysis of the TH reporter line revealed that pancreatic TH signaling is active in islets during the larval-juvenile transition. Therefore, we next investigated how endogenous TH signaling affects α-cell and β-cell development and glucose homeostasis during the larval-juvenile transition. Toward this end, we used the nitroreductase/Mtz system to ablate the thyroid in tg:nVenus-2a-nfsb animals (22,29). We treated tg:nVenus-2a-nfsB fish with Mtz at 20 dpf and analyzed their phenotypes at 30 dpf (Fig. 6A). Overall eGFP expression of the TH reporter was reduced, and TH signaling was not detected in the islets of Mtz-treated animals at 30 dpf (Fig. 6B). Having established that thyroid ablation eliminated TH signaling in endocrine cells, we next analyzed its functional consequences. Islet morphology was unaltered in thyroid-ablated zebrafish (Fig. 6C). Interestingly, we found that compared with the unablated controls, the thyroid-ablated zebrafish exhibited elevated glucose levels (Fig. 6D), that ins expression levels were reduced (Fig. 6E), and that gcg expression levels were increased (Fig. 6E). Furthermore, expression levels of neurod1, pax6b, mnx1, and pax4 were reduced, and expression levels of arxa were increased in the digestive organs (liver, pancreas, and intestine) in thyroid-ablated zebrafish (Fig. 6E). These results suggest that endogenous TH regulates glucose homeostasis during the larval-juvenile transition by modulating the expression of endocrine genes including ins and gcg.
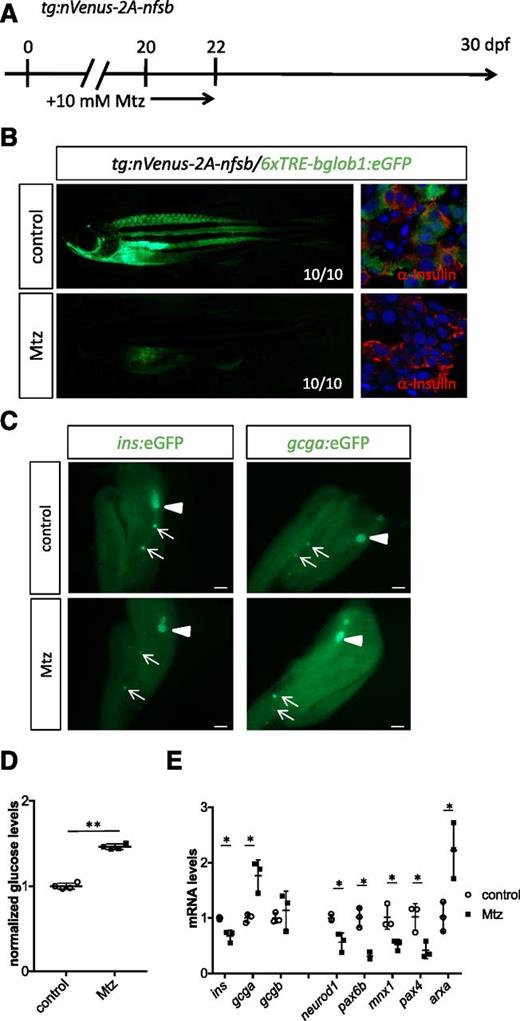
Endogenous TH regulates endocrine marker expression and glucose levels during the larval-to-juvenile transition. A: Schematic detailing the time course of Mtz treatment in Tg(tg:nVenus-2a-nfsB) line to generate hypothyroid zebrafish. B: TH reporter expression was reduced in 30 dpf Tg(tg:nVenus-2a-nfsB)/Tg(6xTRE-bglob1:eGFP) fish after Mtz treatment. C: Morphology of islets in hypothyroid zebrafish at 30 dpf. No morphological differences could be detected in the pancreatic islets between control and Mtz-treated animals. D: Free glucose level measurements at 30 dpf show that hypothyroid zebrafish exhibited elevated glucose levels. E: qPCR analysis of 30 dpf animals treated with or without Mtz reveals that thyroid ablation resulted in a marked decrease of ins, neurod1, pax6b, mnx1, and pax4 expression, while the expression of gcga and arxa was significantly increased. Triangles indicate principal islet. Arrows point to secondary islets. Scale bars, 200 μm. *P < 0.05, **P < 0.01 compared with controls by Student t test.
Endogenous TH regulates endocrine marker expression and glucose levels during the larval-to-juvenile transition. A: Schematic detailing the time course of Mtz treatment in Tg(tg:nVenus-2a-nfsB) line to generate hypothyroid zebrafish. B: TH reporter expression was reduced in 30 dpf Tg(tg:nVenus-2a-nfsB)/Tg(6xTRE-bglob1:eGFP) fish after Mtz treatment. C: Morphology of islets in hypothyroid zebrafish at 30 dpf. No morphological differences could be detected in the pancreatic islets between control and Mtz-treated animals. D: Free glucose level measurements at 30 dpf show that hypothyroid zebrafish exhibited elevated glucose levels. E: qPCR analysis of 30 dpf animals treated with or without Mtz reveals that thyroid ablation resulted in a marked decrease of ins, neurod1, pax6b, mnx1, and pax4 expression, while the expression of gcga and arxa was significantly increased. Triangles indicate principal islet. Arrows point to secondary islets. Scale bars, 200 μm. *P < 0.05, **P < 0.01 compared with controls by Student t test.
T3 Regulates Glucose Metabolism by Stimulating Insulin Secretion and Suppressing Glucagon Secretion in Adults
Analysis of the TH reporter line revealed that pancreatic TH signaling is active in adult islets. Therefore, we next investigated how TH signaling affects α-cell and β-cell function and glucose metabolism in adults. Ten microliters of a 10 nmol/L T3 solution was injected intraperitoneally daily for three consecutive days. After the third injection, the fish were starved for 24 h and then challenged with an intraperitoneal injection of 10 μL of a 2.5% glucose solution. Blood glucose was measured after 45 min (Fig. 7A). Under basal conditions as well as after glucose challenge, T3 pretreatment reduced blood glucose levels (Fig. 7B). Next, pancreata were dissected and the expression levels of ins, gcga, and gcgb were analyzed by qPCR. T3 upregulated expression of ins and downregulated expression of gcga (Fig. 7C), consistent with the effects observed in larvae. T3 did not affect the expression levels of gcgb (Fig. 7C). To address whether altered gene expression levels led to functional effects on hormone secretion, we quantified serum Ins and Gcg levels by dot blot. Serum Ins levels were higher in animals treated with T3 compared with controls (Fig. 7D and F). In contrast, serum Gcg levels were reduced in fish treated with T3 compared with controls (Fig. 7E and F). In addition, we investigated how TH signaling affects α-cell and β-cell function and glucose metabolism in adults by analyzing hypothyroid animals. Mtz was injected intraperitoneally in tg:nVenus-2a-nfsb fish. Beginning 2 days after the Mtz injection, the fish were starved for an additional 24 h and then challenged with a 10-µL intraperitoneal injection of 1% glucose (Fig. 7G). Under basal conditions as well as after glucose challenge, blood glucose levels were elevated in hypothyroid zebrafish (Fig. 7H). The expression levels of ins, gcga, and gcgb in the pancreas of hypothyroid zebrafish were analyzed by qPCR. The expression levels of ins were reduced, while the expression levels of both gcga and gcgb were significantly increased (Fig. 7I). Furthermore, serum Ins levels were reduced (Fig. 7J and L), and serum Gcg levels were elevated in hypothyroid zebrafish (Fig. 7K and L). Thus, TH-mediated effects on pancreatic endocrine hormone expression induce an antihyperglycemic islet secretion profile that improves glucose tolerance.

TH signaling regulates glucose homeostasis by stimulating Ins secretion and repressing Gcg secretion in adult zebrafish. A: Schematic time course of T3 and glucose injections. B: Blood glucose levels in control and T3-treated adult fish before and after glucose injections. C: ins and gcg expression in adult pancreas by qPCR after T3 treatment. D: Plasma Ins levels after T3 treatment compared with control. E: Plasma Gcg levels after T3 treatment compared with control. F: Quantification of D and E. G: Schematic time course of Mtz and glucose injections. H: Blood glucose levels in Tg(tg:nVenus-2a-nfsB) animals treated with Mtz before and after glucose injection. I: ins and gcg expression in adult pancreas by qPCR in Tg(tg:nVenus-2a-nfsB) animals treated with Mtz. J: Plasma Ins levels in Tg(tg:nVenus-2a-nfsB) animals treated with Mtz. K: Plasma Gcg levels in Tg(tg:nVenus-2a-nfsB) animals treated with Mtz. L: Quantification of J and K. *P < 0.05, **P < 0.01 compared with controls by Student t test. IP, intraperitoneal; ns, not significant.
TH signaling regulates glucose homeostasis by stimulating Ins secretion and repressing Gcg secretion in adult zebrafish. A: Schematic time course of T3 and glucose injections. B: Blood glucose levels in control and T3-treated adult fish before and after glucose injections. C: ins and gcg expression in adult pancreas by qPCR after T3 treatment. D: Plasma Ins levels after T3 treatment compared with control. E: Plasma Gcg levels after T3 treatment compared with control. F: Quantification of D and E. G: Schematic time course of Mtz and glucose injections. H: Blood glucose levels in Tg(tg:nVenus-2a-nfsB) animals treated with Mtz before and after glucose injection. I: ins and gcg expression in adult pancreas by qPCR in Tg(tg:nVenus-2a-nfsB) animals treated with Mtz. J: Plasma Ins levels in Tg(tg:nVenus-2a-nfsB) animals treated with Mtz. K: Plasma Gcg levels in Tg(tg:nVenus-2a-nfsB) animals treated with Mtz. L: Quantification of J and K. *P < 0.05, **P < 0.01 compared with controls by Student t test. IP, intraperitoneal; ns, not significant.
Discussion
In this study, we investigated the role of TH signaling during pancreas development in vivo. We found that TH signaling activates ins expression in β-cells and inhibits gcg expression in α-cells. TH also increases the expression of a transcriptional network including the pax6b and mnx1 genes, whose protein products regulate ins expression. Pax6, a pan-endocrine factor, directly regulates β-cell–specific mnx1 expression through a regulatory element in the mnx1 promoter (27). While mnx1 is expressed specifically in β-cells (27), pax6b is expressed in all endocrine cell types, including β-cells (25), and both Mnx1 and Pax6b regulate ins expression. Our data are consistent with a model whereby TH induction of pax6b expression induces mnx1 expression to drive ins expression in β-cells. Furthermore, TH increases the expression of pax4 and inhibits the expression of arxa, protein products of which regulate gcg expression. Arx and Pax4 are mutually antagonistic factors that modulate α-cell development and gcg expression (30). Our data suggest that TH can tilt this balance in favor of Pax4, thus leading to a decrease in α-cell number and gcg expression.
The TH/Pax6 pathway also appears to be at play in mammalian tissues. Exogenous TH signaling can stimulate Ins expression in db/db mice (31), and Pax6 expression is reduced in TH-deficient mice during fetal neurogenesis (32). Thus, Pax6 might be one of the common targets of TH signaling in pancreatic and neural tissues and might explain the coordinated effects of TH signaling during embryogenesis, tissue differentiation, and organ maturation. However, it remains to be investigated whether TH-mediated Pax4 regulation is also at play in mammalian tissues.
TH modulates the differentiation and function of various tissues including the pancreas. However, it has been unclear when and in which cell types TH signals. Our data using a novel TH-responsive transgenic signaling reporter line reveal that in zebrafish, β-cells become TH responsive by 25 dpf and α-cells by 30 dpf. These stages correspond to a critical larval-juvenile transition, when zebrafish acquire an adult morphology and physiology (2,3,7,33). This period is thought to be equivalent to the suckling-to-weaning transition in mammals, when various tissues undergo morphological and functional changes (2–7). During this transition, rodent β-cells acquire progressively higher glucose sensitivity and secretory capacity (9). Our data indicate that islet endocrine cells are competent to respond to TH during larval stages and that their maturation is stimulated by exposure to TH during and after the larval-juvenile transition. Although TH signaling has been implicated in β-cell maturation (14), it is unclear to what extent endogenous TH signaling contributes to mammalian pancreatic development and function. TH signaling is first detected in zebrafish β-cells during the larval-juvenile transition and remains active in adult islets. We found that TH signaling increases pax6 expression, which is required for maintaining the mature β-cell state in rodent islets (34–36). Thus, TH signaling may play a conserved role in the functional maturation of β-cells as well as the maintenance of β-cell function in adult islets. In mammals, Pax6 promotes and maintains β-cell maturation by inducing a transcriptional network that includes MafA (34–37). However, in zebrafish we did not detect mafa expression in pancreatic β-cells (Supplementary Fig. 4). Therefore, in zebrafish, Pax6b may use MafA-independent pathways to induce β-cell maturation. A complete understanding of the diversity of TH-dependent regulatory mechanisms in vertebrates may reveal novel therapeutic strategies to promote β-cell maturation.
Interestingly, our data indicate that islet endocrine cells are competent to respond to exogenous T3 during larval stages but that endogenous T3 levels are not sufficient to stimulate islet cells before 25 dpf. In addition, during development, β- and α-cells become TH responsive at different stages (β-cells by 25 dpf and α-cells by 30 dpf), despite the fact that both cell types have the competence to sense and respond to exogenous T3. Thus, islet cells may have different thresholds for endogenous TH signaling. TH is synthesized in the thyroid as thyroxine (T4), an inactive form for THR activation. Next, T4 is converted into T3, a potent THR activator, by type 1 and type 2 deiodinases (D1 and D2, respectively) in peripheral target tissues and, finally, converted into the inactive T2 form by a type 3 deiodinase (D3) (38). In rat islets, D1 protein levels are much lower at postnatal day 7 compared with adult (14). In contrast, D3 shows a reciprocal pattern (14). Thus, expression of key TH metabolic enzymes may explain the tissue specificity of the TH response. Furthermore, in zebrafish, TH production dramatically increases during the larval-juvenile transition (39). Thus, elevation of TH production/release and elevation of T3 by changes in TH metabolism in target peripheral tissues may produce unique TH responses in each tissue/cell type during the larval-juvenile transition. In addition, it has been reported that Thrα and Thrβ have different expression patterns in rat islets (14). Thrβ is also regulated by TH and marks mature tissues. Thus, analyzing the differences between THRA and THRB may provide additional information necessary to understand the molecular mechanisms of tissue-specific transcriptional regulation and tissue maturation by TH.
Neonatal β-cells differ from adult β-cells in the expression of key metabolic genes including those involved in mitochondrial ATP production (11). TH has been shown to stimulate mitochondrial biogenesis and function through activation of PGC-1 and NRF1 expression (40). TH-stimulated rat islets show an increase in Pgc1a expression at P7, although it is unclear which cell types are TH responsive (14). Thus, TH signaling may increase Ins secretion in β-cells through stimulation of mitochondrial function. Mitochondrial ATP production is also implicated in the inhibition of Gcg secretion by α-cells (41). Thus, increased mitochondrial metabolic activity in TH-responsive islet cells could explain the hyperinsulinemia and hypoglucagonemia that we observed in TH-treated adults. Further analysis of the link between TH signaling and mitochondrial function may provide key insights into the regulation of islet maturation and function.
TH-induced stimulation of Ins secretion and inhibition of Gcg secretion led to reduced fasting glucose levels and increased glucose tolerance in larvae and adults. Unraveling the regulation of TH signaling will help establish its role in the pathophysiology of diseases including diabetes. In humans, both hypothyroidism and hyperthyroidism increase the incidence of diabetes (42). However, preclinical studies indicate that TH therapy attenuates hyperglycemia and insulin resistance in the db/db diabetic mouse model (31). Therefore, exogenous TH administration within the physiological range may have therapeutic applications. The acquisition of TH responsiveness during the functional maturation of islets during the larval-juvenile transition provides an in vivo platform for development of antihyperglycemic therapies modulating this pathway.
Article Information
Acknowledgments. The authors thank Dirk Meyer (University of Innsbruck) for the Mnx1:eGFP line; David Parichy (University of Washington) for the tg:nVenus-2a-nfsB line; Yu Hsuan Carol Yang, Michelle Collins, Jasmin Gäbges, and Einat Blitz (Max Planck Institute for Heart and Lung Research, Bad Nauheim) for critical reading of the manuscript; Sabine Fischer (Max Planck Institute for Heart and Lung Research) for the animal protocols; all members of the laboratory of D.Y.R.S. for helpful discussion; and the fish facility staff for fish care.
Funding. This work was supported in part by funds from the Max Planck Society and the European Union (HumEn) to D.Y.R.S.
Duality of Interest. No potential conflicts of interest relevant to this article were reported.
Author Contributions. H.M. and D.Y.R.S. conceived the project. H.M., S.T.M., D.H., and D.Y.R.S. contributed to discussion of data and manuscript preparation. H.M., S.T.M., and Y.Z. generated data. H.M. and D.Y.R.S. are the guarantors of this work and, as such, had full access to all the data in the study and take responsibility for the integrity of the data and the accuracy of the data analysis.