


Recent genetic studies have identified some alleles that are associated with higher BMI but lower risk of type 2 diabetes, hypertension, and heart disease. These “favorable adiposity” alleles are collectively associated with lower insulin levels and higher subcutaneous–to–visceral adipose tissue ratio and may protect from disease through higher adipose storage capacity. We aimed to use data from 164,609 individuals from the UK Biobank and five other studies to replicate associations between a genetic score of 11 favorable adiposity variants and adiposity and risk of disease, to test for interactions between BMI and favorable adiposity genetics, and to test effects separately in men and women. In the UK Biobank, the 50% of individuals carrying the most favorable adiposity alleles had higher BMIs (0.120 kg/m2 [95% CI 0.066, 0.174]; P = 1E-5) and higher body fat percentage (0.301% [0.230, 0.372]; P = 1E-16) compared with the 50% of individuals carrying the fewest alleles. For a given BMI, the 50% of individuals carrying the most favorable adiposity alleles were at lower risk of type 2 diabetes (odds ratio [OR] 0.837 [0.784, 0.894]; P = 1E-7), hypertension (OR 0.935 [0.911, 0.958]; P = 1E-7), and heart disease (OR 0.921 [0.872, 0.973]; P = 0.003) and had lower blood pressure (systolic −0.859 mmHg [−1.099, −0.618]; P = 3E-12 and diastolic −0.394 mmHg [−0.534, −0.254]; P = 4E-8). In women, these associations could be explained by the observation that the alleles associated with higher BMI but lower risk of disease were also associated with a favorable body fat distribution, with a lower waist-to-hip ratio (−0.004 cm [95% CI −0.005, −0.003] 50% vs. 50%; P = 3E-14), but in men, the favorable adiposity alleles were associated with higher waist circumference (0.454 cm [0.267, 0.641] 50% vs. 50%; P = 2E-6) and higher waist-to-hip ratio (0.0013 [0.0003, 0.0024] 50% vs. 50%; P = 0.01). Results were strengthened when a meta-analysis with five additional studies was conducted. There was no evidence of interaction between a genetic score consisting of known BMI variants and the favorable adiposity genetic score. In conclusion, different molecular mechanisms that lead to higher body fat percentage (with greater subcutaneous storage capacity) can have different impacts on cardiometabolic disease risk. Although higher BMI is associated with higher risk of diseases, better fat storage capacity could reduce the risk.
Introduction
Some obese individuals are metabolically healthy, whereas some normal-weight individuals have an elevated risk of type 2 diabetes, heart disease, and hypertension (1,2). One of the many factors that allows two people of similar BMI to have very different risks of cardiometabolic disease is the capacity of subcutaneous adipose tissue to store excess lipids. The “adipose tissue expandability” hypothesis states that when adipose tissue stops expanding by cell size or number, with continued weight gain, the lipid accumulates preferentially in ectopic sites, such as cardiac, liver, and β-cells, which can lead to heart disease, hypertension, insulin resistance, and type 2 diabetes (3). Single gene studies of extreme forms of obesity and lipodystrophy, two apparently opposite conditions, support the adipose tissue expandability hypothesis (4,5).
Studies of the general population show that most common genetic variants associated with higher BMI are associated with higher risk of type 2 diabetes, hypertension, and heart disease, either individually, as in the case of the variant in the FTO gene (6), or as a genetic risk score (7). However, recent studies also have identified common genetic variants where alleles associated with lower insulin resistance (8) are also associated with higher BMI and body fat percentage and lower risk of type 2 diabetes, hypertension, and heart disease (9–11). These variants include those in the IRS1 gene, where the common allele associated with higher body fat percentage is associated with lower fasting insulin, triglyceride, and LDL cholesterol levels, lower insulin secretion and higher insulin sensitivity, and higher adiponectin, HDL cholesterol, and leptin levels (9). A genetic score of 10 (11) or 11 (10) alleles, including that near IRS1, had a similar profile with the alleles associated with higher BMI also being associated with lower circulating levels of triglyceride and fatty liver markers but higher adiponectin, HDL cholesterol, and sex hormone–binding globulin levels and lower risk of type 2 diabetes, hypertension, and heart disease. These “favorable adiposity” alleles were also associated collectively with a higher subcutaneous–to–visceral adipose tissue ratio (10) and higher body fat mass (11) and may protect from disease by increasing the capacity of subcutaneous adipose tissue to store excess calories as lipids (10). These observations suggest that different molecular mechanisms that lead to higher BMI and higher body fat percentage can have different impacts on metabolic disease, some of which are paradoxical to epidemiological correlations.
We had three aims in this study. First, we aimed to replicate the association of a genetic score of 11 favorable adiposity variants (10) with higher BMI and body fat percentage but lower risk of the three diseases of metabolic syndrome—type 2 diabetes, hypertension, and heart disease. Given the apparently paradoxical associations between higher BMI and lower risk of disease, we wanted to replicate the effects in large studies that were not part of previous genome-wide association study (GWAS) meta-analyses both to confirm associations and establish their true effects in population-based studies. Second, we aimed to test if a genetic score of favorable adiposity variants interacted with a genetic score of variants identified as associated primarily with BMI. Identifying interactions between genetic variants has proven very difficult, but the availability of individual-level data in the UK Biobank provides an opportunity to identify individuals who may be at especially high or low genetic risk of disease if they carry certain combinations of alleles. These BMI variants consisted of those recently identified as associated with BMI in a meta-analysis of 250,000 individuals (12). Third, we aimed to test the role of the favorable adiposity alleles in disease predisposition in men and women separately given the differences in body fat distribution between the two sexes. We used the UK Biobank study to address these questions because it is a single, large, and relatively homogeneous population-based study. We used five additional studies not part of previous GWAS to provide additional statistical confidence of our findings.
Research Design and Methods
Study Samples
All the details of the UK Biobank and the five additional studies are given in Supplementary Table 1.
UK Biobank
The UK Biobank recruited over 500,000 individuals aged 37–73 years (99.5% were between 40 and 69 years) in 2006–2010 from across the U.K. Participants provided a range of information via questionnaires and interviews (e.g., demographics, health status, and lifestyle), and anthropometric measurements, blood pressure readings, and blood, urine, and saliva samples were taken for future analysis, which has been described in more detail elsewhere (13). We used 120,286 individuals of British descent from the initial UK Biobank data set. We did not include other ethnic groups because individually they were underpowered to detect previously reported effects. British descent was defined as individuals who both self-identified as white British and were confirmed as ancestrally Caucasian using principal components (PC) analyses of genome-wide genetic information. This data set underwent extensive central quality control, including the exclusion of the majority of third-degree or closer relatives from a genetic kinship analysis of 96% of individuals. We performed an additional round of PC analyses on these 120,286 UK Biobank participants. We selected 95,535 independent single nucleotide polymorphisms (SNPs) (pairwise r2 < 0.1) directly genotyped with a minor allele frequency ≥2.5% and missingness <1.5% across all UK Biobank participants with genetic data available at the time of this study (N = 152,732) and with Hardy-Weinberg equilibrium (HWE) P > 1E-6 within the white British participants. PCs were subsequently generated using FlashPCA (14).
Additional Studies
To provide further evidence for the role of favorable adiposity alleles, we used a total of 50,753 individuals from five studies: EXTEND (Exeter 10,000) (6,504 individuals of white European descent collected from South West England), GoDARTS (Genetics of Diabetes Audit and Research in Tayside Scotland) (4,086 individuals of white European descent collected from North Scotland) (15), GS:SFHS (Generation Scotland: Scottish Family Health Study) (14,064 individuals of white European descent collected from Scotland) (16), PROSPER (Prospective Study of Pravastatin in the Elderly at Risk) (5,244 individuals of white European descent collected from Scotland, Ireland, and the Netherlands) (17,18), and EPIC (European Prospective Investigation into Cancer)-Norfolk (20,855 individuals of white European descent collected from Norfolk) (19). We chose these studies because they were not part of the published GWAS used in previous studies (10).
Phenotypes
Measures of Adiposity
UK Biobank.
We used BMI and bioimpedance measures of body fat percentage measured by the Tanita BC-418MA body composition analyzer. We used body fat percentage as it is a more accurate measure of body composition. The UK Biobank provided two measures of BMI: one calculated from weight (kg)/height (m2) and one using height and electrical impedance to quantify mass. We excluded individuals (n = 1,172 out of 500,000) with differences >4.56 SDs between impedance and normal BMI measures where both variables were available (94% of data). If only one measure of BMI was available, then it was used (n = 7,290).
Additional Studies.
We used BMI and body fat percentage as measures of adiposity. Body fat percentage was measured using a Tanita digital scale in EXTEND, GS:SFHS, and EPIC-Norfolk.
Measures of Disease and Disease-Related Traits
UK Biobank.
We used three cardiometabolic disease outcomes, type 2 diabetes, hypertension (also represented by continuous measures of systolic and diastolic blood pressure), and heart disease, all using baseline data and following similar definitions to those used in previous GWAS.
We defined type 2 diabetes if three criteria were present: 1) reports of either type 2 diabetes or generic diabetes at the interview, 2) at least a 1-year gap from diagnosis without requiring insulin, and 3) reported age at diagnosis over 35 years to limit the numbers of individuals with slow-progressing autoimmune diabetes or monogenic forms. Individuals not reporting an age of diagnosis were excluded. We also excluded individuals diagnosed with diabetes within the year prior to the baseline study visit as we were unable to determine whether they were using insulin within the first year. Control subjects were individuals not fulfilling these criteria.
We defined hypertension as individuals with systolic blood pressure of >140 mmHg, a diastolic blood pressure of >90 mmHg, or the report of blood pressure medication usage. Control subjects were individuals not fulfilling these criteria. For the analysis of systolic and diastolic blood pressure, we corrected blood pressure measures in people on antihypertensive drugs by adding 15 mmHg to systolic and 10 mmHg to diastolic blood pressure, in keeping with the approach taken by GWAS. As a sensitivity analysis, we used blood pressure measures in individuals who were not on blood pressure medications.
We defined heart disease as individuals who reported angina and/or a heart attack at the interview stage. We defined control subjects as individuals without these conditions. As a sensitivity analysis, we defined heart disease case subjects as only those with heart attack at the interview stage.
Additional Studies.
We used three metabolic disease outcomes: type 2 diabetes, hypertension (also represented by continuous measures of systolic and diastolic blood pressure), and heart disease.
EXTEND defined type 2 diabetes as self-reported or having HbA1c >6.4% and excluded subjects that 1) were aged <35 or >70 years at diagnosis, 2) needed insulin treatment within 1 year of diagnosis, and 3) were aged <45 years and whose age at diagnosis was not known at the time of study. We excluded control subjects that 1) were aged <35 or >70 years at the time of study and 2) had an HbA1c >6.4%. Hypertension and heart disease were self-reported.
GoDARTS defined type 2 diabetes as status at recruitment (case/control). Hypertension was defined as individuals with systolic blood pressure of >140 mmHg or a diastolic blood pressure of >90 mmHg at recruitment. Blood pressure was corrected by adding 15 mmHg to systolic and 10 mmHg to diastolic blood pressure in individuals with hypertension if they were on blood pressure medications.
GS:SFHS defined type 2 diabetes by identifying linkage to prescribing data where drugs prescribed were in British National Formulary code group 6.1. The prescriptions were also used to show which participants were taking blood pressure–lowering drugs (British National Formulary code 2.4, 2.5, and 2.6). Blood pressure was measured twice during a clinic visit and the mean systolic and diastolic values used. Diabetes, hypertension, and heart disease were self-reported on a questionnaire at the time of participation.
PROSPER defined type 2 diabetes by 1) known type 2 diabetes, 2) fasting glucose ≥7 mmol/L, and/or 3) use of antidiabetes drugs (any oral hypoglycemia agent or insulin). Hypertensive individuals were defined as those using antihypertensive medication. They defined heart disease as a combination of prevalent (baseline history of myocardial infarction, coronary artery bypass grafting/percutaneous transluminal coronary angioplasty, and angina) and incident (coronary heart disease death [definite plus suspect], nonfatal myocardial infarction [definite plus suspect], and coronary artery bypass grafting/percutaneous transluminal coronary angioplasty) events. All end points were validated by a blinded events committee. For detailed end point definitions, please see Appendix B in Shepherd et al. (18).
EPIC-Norfolk used both prevalent and incident type 2 diabetes to define type 2 diabetes. They used treatment-adjusted variables for systolic and diastolic blood pressure and blood pressure medication to define hypertension. They defined heart disease as self-reported myocardial infarction at baseline and incident myocardial infarction.
Selection of Genetic Variants Associated With Favorable Adiposity
We chose 11 variants previously identified by a hierarchical clustering approach as sharing features of monogenic lipodystrophic insulin resistance, including a surrogate measure of insulin resistance, subcutaneous–to–visceral adipose tissue ratio from computed tomography scans, lipids, markers of fatty liver disease, and adiponectin (Supplementary Table 2) (10). We refer to the adiposity-raising alleles as “favorable adiposity” alleles throughout the article.
Selection of Genetic Variants Associated With BMI
We selected 69 variants as associated with BMI and refer to the BMI-raising alleles as “BMI” alleles throughout the article. These 69 variants were selected from 76 common genetic variants associated with BMI at genome-wide significance in the Genetic Investigation of ANthropometric Traits (GIANT) Consortium studies of up to 339,224 individuals (Supplementary Table 3) (12). We limited the BMI SNPs to those that were associated with BMI in the analysis of all European ancestry individuals and did not include those that only reached genome-wide levels of statistical confidence in one sex only or one stratum only. Variants were also excluded if classified as a secondary signal within a locus. Three SNPs were excluded due to potential pleiotropy (rs11030104 [BDNF reward phenotypes], rs13107325 [SLC39A8 lipids, blood pressure], and rs3888190 [SH2B1 multiple traits]). Also excluded were three SNPs that were not in HWE (rs17001654, rs2075650, and rs9925964), and one SNP was unavailable (rs2033529) (Supplementary Table 3).
Genotypes
UK Biobank
We extracted genotypes from UK Biobank’s imputation data set and used genotype dosage values prior to association testing. Individual genotypes were excluded if HWE P < E-6 or if imputation quality <0.9. We confirmed that the 11 favorable adiposity variants and the 69 BMI variants were imputed with high quality by comparing them to the directly genotyped data, available in 120,286 UK Biobank individuals of genetically confirmed British ancestry. Details of imputation quality are given in Supplementary Tables 2 and 3.
Additional Studies
Supplementary Table 4 describes the imputation/genotyping methods used by each study.
Genetic Score Analysis
We constructed two genetic scores: 1) the genetic score of 11 favorable adiposity variants was the number of favorable adiposity alleles carried by each individual weighted based on their effect on fasting insulin and 2) the genetic score of 69 BMI variants was the number of alleles associated with higher BMI carried by each individual. As a sensitivity analysis, we conducted a genetic score of favorable adiposity based on variants that were individually associated with body fat percentage in the UK Biobank study.
Statistical Analysis
We assumed an additive model for the analysis of individual variants. We used five covariates including age, sex, genotyping platform (two were used), study center, and five within-U.K. genetic PCs. As smoking has a big effect on BMI, we ran a sensitivity analysis using smoking as a covariate in the UK Biobank data in addition to the above covariates.
We used the genetic risk score for BMI to test the hypothesis that a general genetic predisposition to higher BMI interacted with a general predisposition to favorable adiposity. We did not investigate specific variants for interaction. For this interaction analysis between two genetic scores (69 BMI variants and 11 favorable adiposity variants) and measures of blood pressure and cardiometabolic disease risk, we included the respective interaction terms in the models (e.g., interaction term = BMI genetic score × favorable adiposity genetic score).
Meta-analysis
We did a meta-analysis of the results across the six studies using fixed-effects inverse variance–weighted meta-analysis. We tested for any evidence of heterogeneity between the results using the Cochran Q test.
Sex-Dichotomized Analysis
We repeated the inverse variance–weighted meta-analyses separately in men and women in the UK Biobank study to assess whether or not associations differed between sexes. Sex-difference P values were calculated by the Cochran Q test.
Assessing Disease Risk in Individuals With a Genetic Susceptibility to High BMI
We dichotomized the favorable adiposity genetic score and the BMI genetic score into two groups based on the median of the two genetic score distributions to provide additional context for the interaction analysis. We considered individuals with above median favorable adiposity genetic score and below median BMI genetic score as having the lowest cardiometabolic disease risk and used them as a reference group. In comparison to the reference group, we tested blood pressure and the risk of type 2 diabetes, hypertension, and heart disease in three groups of individuals based on the two genetic score distributions: 1) those at below median of the favorable adiposity genetic score and below median of the BMI genetic score, 2) those at above median of the favorable adiposity genetic score and above median of the BMI genetic score, and 3) those at below median of the favorable adiposity genetic score and above median of the BMI genetic score.
Results
A Genetic Score of 11 Favorable Adiposity Variants Was Associated With Higher BMI and Body Fat Percentage in the UK Biobank
The genetic score of 11 favorable adiposity variants was associated with higher body fat percentage and higher BMI in the UK Biobank with very high levels of statistical confidence. Each additional favorable adiposity weighted allele was associated with a 0.126% (95% CI 0.104, 0.149; P = 8E-28) higher fat percentage and 0.046 kg/m2 (0.029, 0.063; P = 2E-7) higher BMI. These effects meant that the 50% of people carrying the most favorable adiposity alleles had on average 0.301% (0.230, 0.372; P = 1E-16) additional adipose tissue and were 0.120 kg/m2 (0.066, 0.174; P = 1E-5) heavier than the 50% of people carrying the fewest favorable adiposity alleles (Fig. 1A). The 11 variants in a multivariable analysis explained 0.04% variance in BMI levels and 0.2% variance in body fat percentage in the UK Biobank study (N = 119,688) after correcting for age, sex, genotyping array, study center, and within-U.K. PCs. The analysis of the favorable adiposity genetic score against absolute measures of body fat mass and body fat-free mass showed that the effect of the 11 favorable adiposity variants was driven by fat mass not fat-free mass and the genetic score was not associated with height (Fig. 1A and Table 1). The genetic score effects were predominantly driven by 7 of the 11 variants that were individually associated with body fat percentage at P < 3E-5, those in or near the LYPLAL1, PPARG, PEPD, GRB14, IRS1, ANKRD55, and FAM13A genes (Supplementary Table 5).
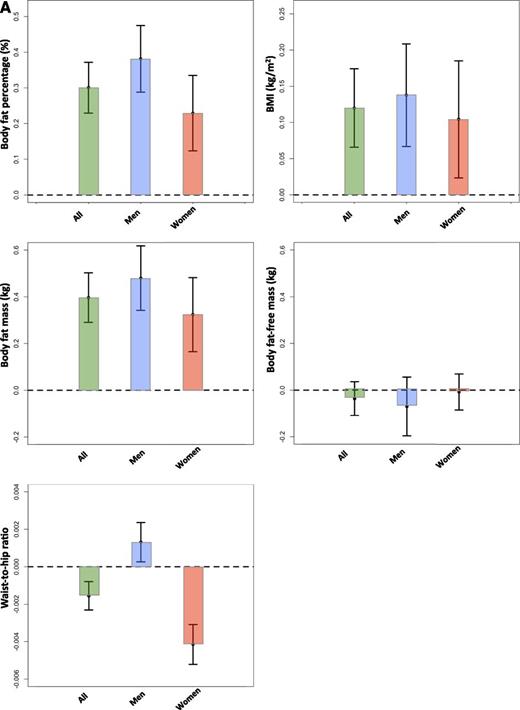

The effect of favorable adiposity on measures of adiposity (A) and cardiometabolic disease risk (B) in the UK Biobank study. Effects are given by comparing the 50% of people carrying the most favorable adiposity alleles with the 50% of people carrying the fewest favorable adiposity alleles. The error bars indicate 95% CI. All models were adjusted for age, sex, genotyping array, study center, and within-U.K. PCs.
The effect of favorable adiposity on measures of adiposity (A) and cardiometabolic disease risk (B) in the UK Biobank study. Effects are given by comparing the 50% of people carrying the most favorable adiposity alleles with the 50% of people carrying the fewest favorable adiposity alleles. The error bars indicate 95% CI. All models were adjusted for age, sex, genotyping array, study center, and within-U.K. PCs.
The effect of a favorable adiposity genetic score on measures of adiposity and cardiometabolic disease risk in the UK Biobank study
| Outcome | Effect size | Lower CI | Upper CI | P | N |
|---|---|---|---|---|---|
| Body fat percentage (%) | 0.126 | 0.104 | 0.149 | 8E-28 | 118,012 |
| BMI (kg/m2) | 0.046 | 0.029 | 0.063 | 2E-7 | 119,688 |
| Body fat mass (kg) | 0.156 | 0.123 | 0.190 | 3E-18 | 118,024 |
| Body fat-free mass (kg) | −0.030 | −0.053 | −0.007 | 0.01 | 118,221 |
| Height (cm) | 0.006 | −0.017 | 0.028 | 0.6 | 120,084 |
| Type 2 diabetes (OR) | 0.943 | 0.924 | 0.963 | 2E-8 | 4,003 vs. 113,203 |
| Systolic blood pressure (mmHg) | −0.255 | −0.334 | −0.176 | 2E-10 | 120,008 |
| Diastolic blood pressure (mmHg) | −0.096 | −0.143 | −0.048 | 7E-5 | 119,821 |
| Hypertension (OR) | 0.982 | 0.974 | 0.989 | 3E-6 | 65,584 vs. 53,377 |
| Heart disease (OR) | 0.967 | 0.950 | 0.984 | 1E-4 | 5,758 vs. 113,930 |
Effects are given per carrying additional adiposity-increasing weighted allele.
A Genetic Score of 11 Favorable Adiposity Variants Was Associated With Lower Waist Circumference and Waist-to-Hip Ratio in Women but Higher Waist Circumference and Waist-to-Hip Ratio in Men
In the UK Biobank, the genetic score of 11 favorable adiposity variants associated with higher BMI was associated with a favorable body fat distribution, as measured by a lower waist-to-hip ratio (−0.0006 [95% CI −0.0009, −0.0004] per allele; P = 2E-7) but these effects were dichotomized by sex. In women, the alleles associated with higher BMI were also associated with a lower waist-to-hip ratio (−0.0017 [−0.0021, −0.0014] per allele; P = 9E-23), an effect driven by a larger hip circumference (0.16 [0.11, 0.21] per allele; P = 1E-9), with little effect on waist circumference (−0.04 [−0.10, 0.02] per allele; P = 0.2). In men, the favorable adiposity genetic risk score associated with higher BMI was associated with higher waist circumference (0.17 [0.11, 0.23] per allele; P = 1E-8), higher hip circumference (0.12 [0.08, 0.16] per allele; P = 1E-8), and slightly higher waist-to-hip ratio (0.0005 [0.0002, 0.0009] per allele; P = 0.001) (Supplementary Table 6). These effects meant that the 50% of men carrying the most favorable adiposity alleles had a waist circumference 0.45 cm larger (0.267, 0.641; P = 2E-6) than the 50% of men carrying the fewest favorable adiposity alleles. These associations were consistent when the meta-analysis of the UK Biobank data with three additional studies was conducted (Fig. 2). These effects were even stronger when limiting the favorable adiposity genetic score to the seven variants that were individually associated with body fat percentage at P < 3E-5, those in or near the LYPLAL1, PPARG, PEPD, GRB14, IRS1, ANKRD55, and FAM13A genes (Supplementary Table 6).
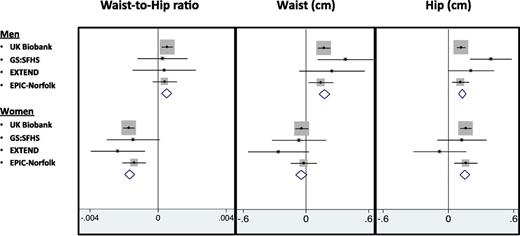
The effect of favorable adiposity on measures of body distribution including waist circumference, hip circumference, and waist-to-hip ratio separated by sex. Effects are per additional weighted copy of the adiposity-increasing allele. All models were adjusted for age, sex, genotyping array, study center, and PCs, where applicable.
The effect of favorable adiposity on measures of body distribution including waist circumference, hip circumference, and waist-to-hip ratio separated by sex. Effects are per additional weighted copy of the adiposity-increasing allele. All models were adjusted for age, sex, genotyping array, study center, and PCs, where applicable.
A Genetic Score of 11 Favorable Adiposity Variants Was Associated With Lower Risk of Type 2 Diabetes
Despite being associated with higher fat mass, each additional favorable adiposity weighted allele was associated with an OR of 0.943 (95% CI 0.924, 0.963; P = 2E-8) for lower risk of type 2 diabetes in the UK Biobank. This association was statistically stronger when the meta-analysis of the UK Biobank data with five additional studies was conducted (Supplementary Table 7). These effects meant that the 50% of people carrying the most favorable adiposity alleles had an OR of 0.895 (0.840, 0.954; P = 6E-4) for lower risk of type 2 diabetes than the 50% of people carrying the fewest favorable adiposity alleles (Fig. 1B and Supplementary Table 8). Despite the dichotomized body fat distribution, these effects were consistent in men and women (Supplementary Table 9) and across six different bands of BMI (<25, 25–30, 30–35, 35–40, and >40 kg/m2) (Fig. 3). The effect was similar when we used smoking as a covariate (Supplementary Table 10) and, as expected, was stronger when we used seven variants that were individually associated with body fat percentage at P < 3E-5 (Supplementary Table 11).
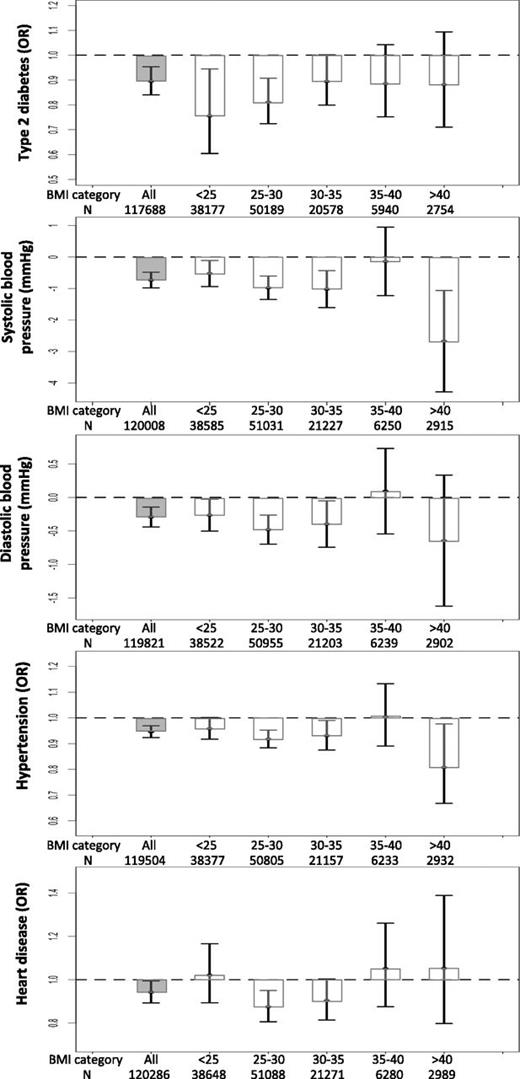
The effect of favorable adiposity on measures of adiposity and cardiometabolic disease risk in the UK Biobank study in all individuals and in individuals split into BMI categories (kg/m2). Effects are given by comparing the 50% of people carrying the most favorable adiposity alleles with the 50% of people carrying the fewest favorable adiposity alleles in all individuals and within BMI strata. The error bars indicate 95% CI. All models were adjusted for age, sex, genotyping array, study center, and within-U.K. PCs.
The effect of favorable adiposity on measures of adiposity and cardiometabolic disease risk in the UK Biobank study in all individuals and in individuals split into BMI categories (kg/m2). Effects are given by comparing the 50% of people carrying the most favorable adiposity alleles with the 50% of people carrying the fewest favorable adiposity alleles in all individuals and within BMI strata. The error bars indicate 95% CI. All models were adjusted for age, sex, genotyping array, study center, and within-U.K. PCs.
We next used the genetic score for favorable adiposity and a genetic risk score for BMI to test the hypothesis that a general genetic predisposition to higher BMI interacted with a general predisposition to favorable adiposity. We did not investigate specific variants for interaction. There was no evidence of interaction between the genetic score of favorable adiposity alleles and the genetic score of 69 BMI alleles (Pinteraction > 0.05). Despite being more overweight, carrying more favorable adiposity alleles than average reduced the risk of type 2 diabetes in the 50% of individuals most genetically predisposed to high BMI (OR 0.885 [0.813, 0.965]; P = 0.005) (Fig. 4 and Supplementary Table 12). These effects were consistent with those expected given additive effects of the alleles.
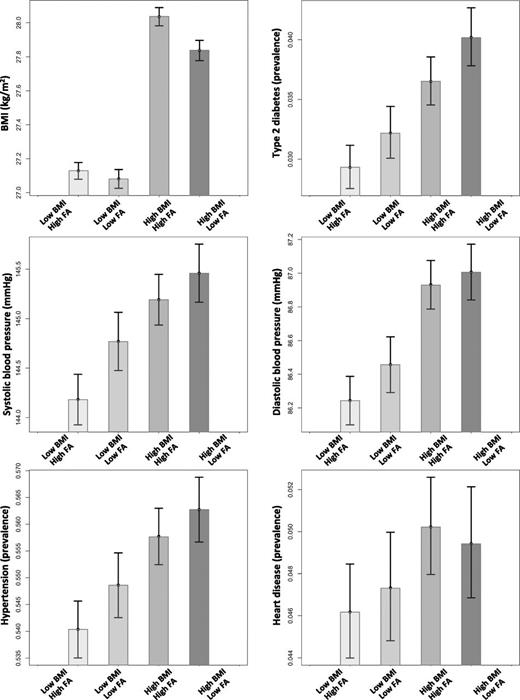
The combined effect of favorable adiposity (FA) and BMI genetic scores on cardiometabolic disease risk. We grouped the UK Biobank individuals based on the median of the two genetic score distributions: 1) low BMI–high FA: individuals with below median BMI genetic score and above median FA genetic score, 2) low BMI–low FA: individuals with below median BMI genetic score and below median FA genetic score, 3) high BMI–high FA: individuals with above median BMI genetic score and above median FA genetic score, and 4) high BMI–low FA: individuals with above median BMI genetic score and below median FA genetic score. The error bars indicate 95% CI.
The combined effect of favorable adiposity (FA) and BMI genetic scores on cardiometabolic disease risk. We grouped the UK Biobank individuals based on the median of the two genetic score distributions: 1) low BMI–high FA: individuals with below median BMI genetic score and above median FA genetic score, 2) low BMI–low FA: individuals with below median BMI genetic score and below median FA genetic score, 3) high BMI–high FA: individuals with above median BMI genetic score and above median FA genetic score, and 4) high BMI–low FA: individuals with above median BMI genetic score and below median FA genetic score. The error bars indicate 95% CI.
A Genetic Score of 11 Favorable Adiposity Variants Was Associated With Lower Risk of Hypertension
Despite being associated with higher fat mass, each additional favorable adiposity weighted allele was associated with a 0.255 mmHg (95% CI −0.334, −0.176; P = 2E-10) lower systolic blood pressure, 0.096 mmHg (−0.143, −0.048; P = 7E-5) lower diastolic blood pressure, and an OR of 0.982 (0.974, 0.989; P = 3E-6) for lower risk of hypertension in the UK Biobank (Table 1). These associations were statistically stronger when the meta-analysis the UK Biobank data with five additional studies was conducted (Supplementary Table 7). These effects meant that the 50% of people carrying the most favorable adiposity alleles had a 0.732 mmHg (−0.980, −0.484; P = 7E-9) lower systolic blood pressure, 0.292 mmHg (−0.440, −0.144; P = 1E-4) lower diastolic blood pressure, and an OR of 0.946 (0.923, 0.969; P = 7E-6) for lower risk of hypertension than the 50% of people carrying the fewest favorable adiposity alleles (Fig. 1B and Supplementary Table 8). Despite the dichotomized body fat distribution, these effects were consistent in men and women (Supplementary Table 9) and across six different bands of BMI (<25, 25–30, 30–35, 35–40, and >40 kg/m2) (Fig. 3). These effects were similar when we used smoking as a covariate or when we excluded individuals on blood pressure medication (Supplementary Table 10). As expected, the effects were stronger when we used seven variants that were individually associated with body fat percentage at P < 3E-5 (Supplementary Table 11).
There was no evidence of interaction between the genetic score of favorable adiposity alleles and the genetic score of 69 BMI alleles on systolic or diastolic blood pressure or the risk of hypertension (Pinteraction = 0.1, 0.07, and 0.7, respectively). Despite being more overweight, carrying more favorable adiposity alleles than average reduced the risk of hypertension in the 50% of individuals most genetically predisposed to high BMI (OR 0.960 [95% CI 0.927, 0.994]; P = 0.02) and lowered their average systolic blood pressure (−0.475 [−0.829, −0.121]; P = 0.009) but had no detectable effect on diastolic blood pressure (Fig. 4 and Supplementary Table 12). These effects were consistent with those expected given additive effects of the alleles.
A Genetic Score of 11 Favorable Adiposity Variants Was Associated With Lower Risk of Heart Disease
Despite being associated with higher fat mass, each additional favorable adiposity weighted allele was associated with an OR of 0.967 (95% CI 0.950, 0.984; P = 1E-4) for lower risk of heart disease in the UK Biobank (Table 1). This association was consistent when the meta-analysis the UK Biobank data with five additional studies was conducted (Supplementary Table 7). On the basis of the UK Biobank study, these effects meant that the 50% of people carrying the most favorable adiposity alleles had an OR of 0.942 (0.892, 0.994; P = 0.03) for lower risk of heart disease (Fig. 1B and Supplementary Table 8). Despite the dichotomized body fat distribution, these effects were consistent in men and women, although they did not reach P < 0.05 in women, where there were fewer heart disease cases (Supplementary Table 8). These effects were similar when we used smoking as a covariate or when we considered only individuals with the history of heart attack as case subjects (Supplementary Table 10). The effects were stronger when we used seven variants that were individually associated with body fat percentage at P < 3E-5 (Supplementary Table 11).
There was no evidence of interaction between the genetic score of favorable adiposity alleles and the genetic score of 69 BMI alleles (Pinteraction = 0.5). Carrying more favorable adiposity alleles than average in the genetically predisposed individuals to high BMI had no detectable effect on risk of heart disease (Fig. 4 and Supplementary Table 12).
Effects of Favorable Adiposity Alleles on Disease Increase When Correcting for BMI
As expected given that the favorable adiposity genetic score is associated with higher BMI, when we corrected for BMI, associations with reduced disease risk strengthened (Supplementary Table 13). These results showed that, for a given BMI, the 50% of individuals carrying the most favorable adiposity alleles were at lower risk of type 2 diabetes (OR 0.837 [95% CI 0.784, 0.894]; P = 1E-7), hypertension (OR 0.935 [0.911, 0.958]; P = 1E-7), and heart disease (OR 0.921 [0.872, 0.973]; P = 0.003) and had lower blood pressure (systolic: −0.859 mmHg [−1.099, −0.618]; P = 3E-12 and diastolic: −0.394 mmHg [−0.534, −0.254]; P = 4E-8). These effects were consistent in men and women.
Discussion
We replicated with very high statistical confidence results from previous studies showing that, in combination, 11 common genetic variants are associated with higher adiposity but lower risk of type 2 diabetes, hypertension, and heart disease. In total, we used 164,609 individuals from six studies, including the UK Biobank, and included 6,735, 82,512, and 8,881 individuals with type 2 diabetes, hypertension, and heart disease, respectively. These studies had not contributed to previous GWAS and thus our study provides a completely independent replication of an apparently paradoxical association—alleles associated with higher fat mass lower the risk of metabolic disease. Our analyses separated by sex provided further insight into the likely mechanisms underlying these apparently paradoxical associations. In women, the extra body fat conferred by the favorable adiposity genetic score was more likely to be in the lower body, as measured by a lower waist-to-hip ratio and especially larger hip circumference. In men, however, the extra body fat conferred by the favorable adiposity genetic score was more likely to be in the upper body, as indicated by a higher waist circumference and waist-to-hip ratio. Data from previous studies provide some further explanation for the apparently paradoxical association. For example, in combination, the favorable adiposity alleles are associated with higher subcutaneous–to–visceral adipose tissue ratio (10), higher insulin sensitivity, higher hip circumference, and higher gynoid and leg fat mass (11). This set of associations is consistent with the alleles labeled as favorable adiposity (or most of them) exerting their effects through a primary role in adipose tissue and fat storage capacity, although we cannot rule out mechanisms where insulin resistance is the primary starting point.
Our data replicate previous associations but provide an important advance for several reasons. First, we provide further evidence that the favorable adiposity alleles are associated predominantly with higher fat mass rather than any other aspect of BMI, such as lean mass. This finding is consistent with previous studies (9–11) and important because it shows that the alleles associated with higher BMI are not protected from disease through higher muscle mass. Instead, our results confirm that the genetic score associated with lower disease risk is associated with higher adiposity. Second, our data of body fat mass and body fat percentage in 118,012 individuals indicate that the favorable adiposity effects are likely limited to 7 of the 11 variants. Two of these variants, those in IRS1 and PPARG, are well known and lie near genes with a well-established role in insulin signaling and adipocyte differentiation, respectively. Our study shows that the variants in or near LYPLAL1, PEPD, GRB14, ANKRD55, and FAM13A, all of which were associated with body fat percentage at P < 3E-5, are very strong candidates for a role in adipocyte biology, an interpretation consistent with the fact that two of these variants, those in LYPLAL1 and GRB14, were associated with waist-to-hip ratio at genome-wide significance in previous GWAS of waist-to-hip ratio (20). Third, we have quantified the effects of genetically higher BMI on disease in a very large population-based study, which means effects are relatively unbiased by disease ascertainment. Fourth, as we used a single, very large population with individual-level data available, we were able to look for interactions between a genetic predisposition to higher BMI and favorable adiposity. We also found that the effects of the favorable adiposity variants on disease risk were similar across all bands of BMI. These interaction analyses, made feasible by the availability of individual-level data in a single, very large study, showed two things. First, that the favorable adiposity alleles reduce the risk of disease at all BMIs and at high and low genetic risk of obesity (based on alleles identified by the GIANT Consortium). Second, that there is no evidence of a synergistic effect that means some individuals are at especially high or low genetic risk of adverse adiposity effects.
Our study had a number of limitations. First, we do not know which molecular pathways lead to a favorable adiposity phenotype, although the presence of variants near the PPARG and IRS1 genes point to known mechanisms (21–23). Second, the 11 variants only explain a very small proportion of body fat percentage and disease risk. Many other factors will influence the difference in disease risk between two individuals of the same BMI. However, our results show that higher fat storage capacity is a likely mechanism that improves metabolic health in the general population. Third, the study of individual variants suggests that those at ARL15 and TET2 may not represent a favorable adiposity phenotype. The final variant, that in RSPO3, is associated with the waist-to-hip ratio in previous GWAS and in the UK Biobank (data not shown) but not with altered BMI or fat mass and thus may represent a simple redistribution of the same amount of body fat. The signal at PDGFC may have a very subtle effect and needs further investigation. A further limitation is that we have not examined whether or not the variants alter adipocyte cell size or related features of adipocyte “function,” and future studies are needed to examine features of adipocytes in tissue biopsies from individuals carrying many favorable adiposity alleles.
In summary, the strong association between the favorable adiposity genetic score and body fat percentage and lower risk of cardiometabolic diseases regardless of BMI or high genetic predisposition to obesity suggests that the mechanism of disease protection is an increased capacity to store triglyceride subcutaneously. The explanation most compatible with our findings is that the increased adipose storage capacity is in the lower body in women but in the upper body in men. Individuals who have genetically higher fat storage capacity can stay metabolically healthier at higher BMIs than individuals without such genetic variation, thereby partially explaining the concept of individual BMI thresholds to develop metabolic disease.
Article Information
Acknowledgments. The authors thank University of Exeter Medical School. EXTEND data were provided by the Peninsula Research Bank, part of the National Institute for Health Research Exeter Clinical Research Facility. This research was conducted using the UK Biobank Resource.
Funding. H.Y., A.R.W., and T.M.F. are supported by the European Research Council grants 323195 and SZ-245 50371-GLUCOSEGENES-FP7-IDEAS-ERC. J.T. is funded by a Diabetes Research & Wellness Foundation fellowship. S.E.J. is funded by the Medical Research Council (MR/M005070/1). R.B. is also funded by the Wellcome Trust and Royal Society grant 104150/Z/14/Z. M.A.T., A.M., and M.N.W. are supported by the Wellcome Trust Institutional Strategic Support Fund (WT097835MF). A.H. is a Wellcome Trust Senior Investigator and a National Institute of Health Research senior investigator. R.M.F. is a Sir Henry Dale Fellow (Wellcome Trust and Royal Society grant 104150/Z/14/Z). E.P. holds a Wellcome Trust New Investigator Award (102820/Z/13/Z). The Wellcome Trust provides support for GoDARTS (awards 072960/z/03/z and 099177/z12/z). The PROSPER study was supported by an investigator-initiated grant obtained from Bristol-Myers Squibb. J.W.J. is an Established Clinical Investigator of the Netherlands Heart Foundation (2001 D 032). Support for genotyping was provided by the 7th Framework Programme of the European Commission (223004) and by the Netherlands Genomics Initiative (Netherlands Consortium for Healthy Ageing grant 050-060-810). This work was performed as part of an ongoing collaboration of the PROSPER study group in the Universities of Leiden, Glasgow, and Cork. The research leading to these results has received funding from the Netherlands Consortium for Healthy Ageing and the European Commission Seventh Framework Programme (FP7/2007-2013) under grant agreement n° HEALTH-F2-2009-223004 PHASE. The University of Edinburgh is a charitable body, registered in Scotland, with registration number SC005336. GS:SFHS received core funding from the Chief Scientist Office of the Scottish Government Health Directorate CZD/16/6 and the Scottish Funding Council grant HR03006. Genotyping of the GS:SFHS samples was carried out by the Genetics Core Laboratory at the Wellcome Trust Clinical Research Facility, Edinburgh, Scotland, and was funded by the U.K.’s Medical Research Council and the Wellcome Trust. Ethics approval for the study was given by the National Health Service Tayside Research Ethics Committee (reference 05/S1401/89). EPIC-Norfolk was funded by the Medical Research Council Canada grants MC_UU_12015/1 and MC_PC_13048.
The funders had no influence on study design, data collection and analysis, the decision to publish, or the preparation of the manuscript.
Duality of Interest. No potential conflicts of interest relevant to this article were reported
Author Contributions. H.Y. and T.M.F. conceived and designed the study. H.Y. analyzed the data and wrote the first draft of the manuscript. H.Y., J.T., S.E.J., R.B., M.A.T., K.S.R., R.M.F., A.R.W., A.M., and M.N.W. performed data processing in the UK Biobank data. H.Y., A.H., and T.M.F. (with EXTEND); L.A.L., C.L., N.J.W., and R.A.S. (with EPIC-Norfolk); R.A.J.S., S.P., J.W.J., and N.S. (with PROSPER); L.D., C.C.P., and E.P. (with GoDARTS); and A.C. and C.H. (with GS:SFHS) performed statistical analysis and provided data. All coauthors commented on the manuscript and agreed with the manuscript results and conclusions. T.M.F. is the guarantor of this work and, as such, had full access to all the data in the study and takes responsibility for the integrity of the data and the accuracy of the data analysis.
Prior Presentation. Parts of this study were presented in poster form at the 76th Scientific Sessions of the American Diabetes Association, New Orleans, 10–14 June 2016.