

Abstract
Background: The pathogenesis of chronic kidney disease associated anemia is multifactorial and includes decreased production of erythropoietin (EPO), iron deficiency, inflammation, and EPO resistance. To better understand the trajectory of these parameters, we described temporal trends in hemoglobin (Hb), ferritin, transferrin saturation, C-reactive protein (CRP), and darbepoetin dosing in the Trial to Reduce cardiovascular Events with Aranesp Therapy (TREAT). Methods: We performed a post hoc analysis of 4,038 participants in TREAT. Mixed effects linear regression models were used to determine the trajectory of parameters of interest prior to end-stage renal disease (ESRD). Likelihood ratio tests were used to determine the overall differences in biomarker values and differences in trajectories between those who did and did not develop ESRD. Results: Hb declined precipitously in the year prior to the development of ESRD (irrespective of treatment assignment), and was on average 1.15 g/dL (95% CI –1.26 to –1.04) lower in those who developed ESRD versus those who did not, at the time of ESRD/end of follow-up. Simultaneously, the mean darbepoetin dose and CRP concentration increased, while serum ferritin and transferrin saturations were >140 μg/L and 20%, respectively. Conclusions: Our analyses provide descriptive insights regarding the temporal changes of Hb, darbepoetin dose, and related parameters as ESRD approaches in participants of TREAT. Hb declined as much as 1–2 years prior to the development of ESRD, without biochemical evidence of iron deficiency. The most precipitous decline occurred in the months immediately prior to ESRD, despite administration of escalating doses of darbepoetin and in parallel with an increase in CRP.
Introduction
In the United States, chronic kidney disease (CKD) affects approximately 11.5% of the general population [1] and 40% of those with self-reported diabetes mellitus [2]. Anemia (defined as hemoglobin (Hb) <12 g/dL in men and <11 g/dL in women) is a common comorbid condition in diabetic patients with CKD and is estimated to affect 22% of patients with CKD stage 3 and 52% with CKD stage 4 [3]. The presence of anemia in CKD is associated with an increased risk of cardiovascular events, all-cause mortality [4], and progression to end-stage renal disease (ESRD) [5].
Progressive loss of renal function is associated with inadequate erythropoiesis and lowering of the blood Hb concentration. Other factors that may contribute to the development of anemia as CKD progresses include iron deficiency and inflammation [6]. The introduction of recombinant erythropoietin (EPO) heralded a new era in nephrology, as the requirement for repeated blood transfusions was negated, and Hb could be maintained at near normal levels [7, 8]. However, several studies reported that targeting “normal” Hb levels was not associated with benefit, but rather with potential harm [9-11], while a lack of responsiveness to exogenous EPO is associated with greater risk of CV events and death [12]. A contemporary approach that examines the sequential changes of Hb decline relative to markers of iron deficiency, inflammation, and darbepoetin dosing may provide important clinical insights, building on what is already known in this area.
The repeated scheduled ascertainment of Hb, and other biomarkers, in the Trial to Reduce cardiovascular Events with Aranesp Therapy (TREAT) [11] provided an opportunity to describe the temporal trends of Hb prior to the occurrence of ESRD. Furthermore, making comparisons to a group of participants who did not develop ESRD (both in the presence and absence of randomized darbepoetin versus placebo therapy) was possible.
Methods
Study Design and Population
In these post hoc and descriptive analyses, we evaluated longitudinal changes in biomarkers of interest (Hb, ferritin, transferrin saturation, C-reactive protein [CRP], creatinine, estimated glomerular filtration rate (eGFR), urine protein/creatinine ratio [PCR] and average monthly darbepoetin dose) in participants of the TREAT study. The design and original results of TREAT (NCT00093015) have been published [11, 13]. TREAT was a prospective, double-blind, randomized controlled trial of darbepoetin alfa versus placebo for the treatment of anemia in 4,038 participants with type 2 diabetes mellitus (T2DM), eGFR of 20–60 mL/min/1.73 m2 according to the 4-variable Modification of Diet in Renal Disease Study equation, Hb <11.0 g/dL, and transferrin saturation >15%. The initial dose of darbepoetin in the active treatment arm was 0.75 μg/kg, with doses adjusted on a monthly basis according to a computer-based algorithm to target Hb at 13 g/dL. In the placebo arm, if Hb fell below 9 g/dL, “rescue” therapy with a single dose of 0.45 μg/kg darbepoetin was given (online suppl. Fig. 1; for all online suppl. material, see www.karger.com/doi/10.1159/000485326). Per protocol, all participants were regularly assessed (and treated as needed) for serum markers of iron sufficiency (ferritin and transferrin saturation; online suppl. Fig. 2). All participants gave written informed consent to be part of the primary trial and the serum samples were used in this analysis (Partners IRB 2005P000170).
Statistical Analyses
A contemporary descriptive analytic approach was employed, whereby temporal trends in biomarkers were plotted by working retrospectively from the time of an event of interest (i.e., ESRD). In these analyses, the exposure variable for those who developed ESRD was the date of the confirmed ESRD event subtracted from the date of the biomarker measurement (i.e., time prior to ESRD). ESRD (n = 668) was defined as initiation of renal replacement therapy (RRT; sustained for at least 30 days), initiation of RRT with death within 30 days, a physician recommendation to initiate RRT with documented participant refusal, or receipt of a kidney transplant. The outcome variable was the measured biomarker of interest. Owing to right-skewed distributions, log-transformation was performed for ferritin, CRP, urine PCR, and creatinine, and corresponding estimates were produced using geometric means. The CRP assay had a lower limit of detection of 3.0 mg/L; for those with concentrations below this limit, a value of 1.5 mg/L was imputed for these analyses.
In order to provide meaningful comparisons, similar analyses were performed in a comparator group of TREAT participants who did not experience ESRD during follow-up (n = 3,370). For these individuals, time prior to end of follow-up (EOF) was similarly calculated as date of the EOF subtracted from the date of the biomarker measurement. To ensure the follow-up of this group was comparable to those who developed ESRD (i.e., participants entered analyses at randomization, were followed for the same average duration, and EOF was not induced by death), a modified EOF (mEOF) was created by shortening the exposure duration by 310 days. Therefore, the average duration between randomization and EOF was identical (563 days) for both subgroups. In exploratory analyses, a propensity-score algorithm (based on baseline age, gender, race, eGFR, and urine PCR) was used to select non-ESRD comparators that were similar with respect to those who went on to develop ESRD.
Baseline variables were summarized such that continuous variables were examined graphically and recorded as means (±SD) for normally distributed data, or medians (with interquartile ranges) for non-normally distributed data. Categorical variables were examined by frequency distribution and recorded as proportions. Tests for difference according to ESRD were conducted using t tests, Wilcoxon Rank Sum tests, and the chi-square test for trend for continuous normal, continuous non-normal, and categorical data respectively.
Average values of biomarker measurements prior to ESRD/mEOF were estimated through the use of a mixed effects linear regression model, using participant IDs as random effects. To allow for potentially non-linear changes over time, days prior to ESRD/mEOF were modeled using restricted cubic spline terms with 4 knots. The relationship between time and the average biomarker values was modeled using interaction terms between the group indicator (ESRD vs. not) and the cubic spline terms representing days prior to ESRD/mEOF. From this model, estimates of the average difference between those who developed ESRD versus those who did not were produced at 0, 1, 2, and 3 years prior to the ESRD/mEOF. Likelihood ratio tests were performed comparing the full model (with group variables and interaction terms) to (1) models without any group variable or interaction terms to perform global tests for differences in biomarker values between groups; (2) models without any interaction terms to perform global tests for differences in biomarker trajectories over time. Estimated time of divergence of biomarkers of interest (ESRD vs. not) was defined as the latest time at which the difference in point estimates became significant at α = 0.01. A pre-specified sub-group analysis was performed according to randomized treatment arm and baseline use of angiotensin converting enzyme inhibitors (ACEi) or angiotensin receptor blockers (ARB).
Recognizing that the trajectories of biomarkers changed most markedly during the last 6 months prior to ESRD/mEOF, the following exploratory analyses were performed to explore potential associations with clinical variables according to the development of ESRD or not: use of a more stringent biochemical definition of iron sufficiency (transferrin saturation >30% and ferritin >200 μg/L); the proportion of participants that developed a gastrointestinal (GI) bleed. For all other analyses, nominal 2-sided p values of <0.05 were considered statistically significant. All analyses were performed using STATA 14 (College Station, TX, USA).
Results
Baseline Characteristics
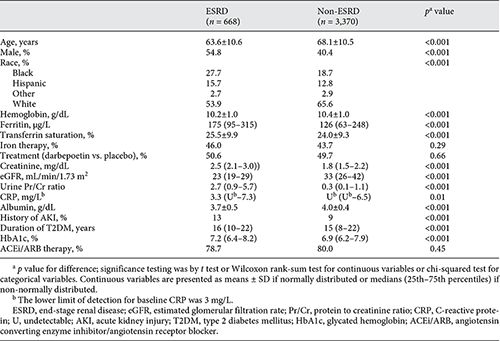
The primary cohort consisted of 4,038 individuals (57% women) with a median age of 68 [11]. At baseline, those who ultimately developed ESRD were more likely to be younger, male, and black and to have a longer duration of T2DM and higher HbA1c compared with those who did not. Those who developed ESRD were more likely to have lower baseline Hb, serum albumin, eGFR, and to have higher ferritin, transferrin saturation, CRP, creatinine, urine PCR, and more likely to have a history of acute kidney injury (Table 1).
Trajectory of Hb
In the placebo arm, 3 years prior to the development of ESRD/mEOF, Hb was similar in those who ultimately developed ESRD compared with those who did not (10.4 vs. 10.3 g/dL; p = 0.10; Table 2). However, from the beginning, the overall trajectory of Hb in those who went on to develop ESRD was downwards, with a more precipitous decline evident in the year prior to the ESRD event. For those who did not develop ESRD, Hb modestly increased over time.

In the treatment arm, Hb initially increased for both those who did and did not go on to develop ESRD. However, approximately 1.6 years prior to the ESRD/mEOF, the trajectories were significantly different, such that Hb continued to increase in those who did not develop ESRD but declined in those who did. This decline was more marked in the year prior to ESRD, such that at the time of ESRD/mEOF, the Hb was lower (1.0 g/dL; 95% CI –1.1 to –0.9 g/dL) in those with ESRD (Fig. 1; Table 2). There was no evidence of difference in patterns according to the baseline use of ACEi/ARB medications (online suppl. Fig. 3).
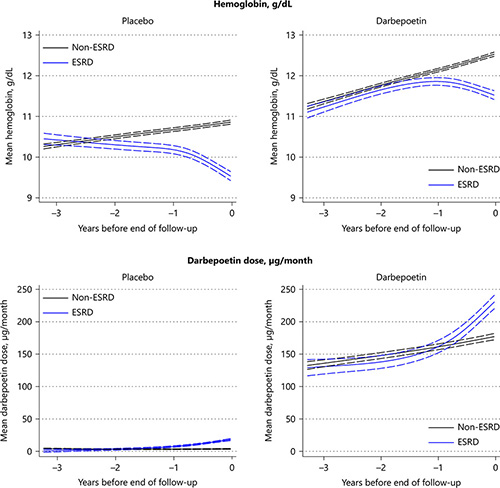
Trajectory of hemoglobin and darbepoetin dose according to the development of ESRD.
Trajectory of hemoglobin and darbepoetin dose according to the development of ESRD.
Trajectory of Darbepoetin Dosing
In the placebo arm (where, per protocol, only “rescue” doses of darbepoetin were provided), in the year prior to ESRD/mEOF, there was an increase in the average monthly dose of darbepoetin in those who went on to develop ESRD, compared with those who did not. The trajectory in those who did not develop ESRD remained relatively flat. The estimated time of divergence of the dosing trajectories was ∼1.4 years prior to the time of ESRD/mEOF (Fig. 1; Table 2).
In the treatment arm, the average monthly dose of administered darbepoetin (determined by a predefined algorithm) increased steadily in all participants between 3 years and one year prior to the development of ESRD/mEOF. However, for those who ultimately progressed to ESRD, there was a notable increase in the darbepoetin dosing during the year prior to this event, with significant divergence of the dose trajectory occurring ∼0.6 years prior to this event (Fig. 1; Table 2).
Trajectory of Ferritin
The trajectory of serum ferritin was similar for participants in both the placebo and treatment arms, such that ferritin increased over time for both those who did and did not develop ESRD but was always significantly higher in the ESRD group. Overall, ferritin was relatively lower at each time point examined in the darbepoetin arm as compared with the placebo arm (Fig. 2; Table 2).

Trajectory of serum ferritin, transferrin saturation, and C-reactive protein according to the development of ESRD.
Trajectory of serum ferritin, transferrin saturation, and C-reactive protein according to the development of ESRD.
Trajectory of Transferrin Saturation
In the placebo arm, transferrin saturations were marginally higher in those who developed ESRD at 3 years prior to ESRD/mEOF, but subsequently the trajectories were overlapping until the months immediately preceding ESRD/mEOF, when the transferrin saturations declined in those who developed ESRD. In the darbepoetin arm, the trajectories were overlapping and increased over time for both those who did and did not develop ESRD. However, in the months immediately prior to ESRD/mEOF, the transferrin saturation trajectory declined in those who went on to develop ESRD (Fig. 2; Table 2).
Trajectory of CRP
In the placebo arm, CRP was marginally higher in those who developed ESRD during the period of 3 years to 1 year prior to ESRD/mEOF. After this point, CRP began to markedly increase in those who went on to develop ESRD, with the trajectory significantly diverging ∼0.6 years prior to the ESRD event. In the darbepoetin arm, 3 years prior to the development of ESRD/mEOF, CRP concentrations were similar in those who did and did not develop ESRD (P difference = 0.35). During the initial follow-up, CRP increased in both groups, but for those who developed ESRD, a more marked rise was evident in the year prior to the ESRD event, with the trajectories significantly diverging ∼0.4 years prior (Fig. 2; Table 2).
Trajectory of Serum Creatinine, eGFR, and Urine PCR
The trajectories of serum creatinine and eGFR followed expected patterns for those who did and did not develop ESRD (online suppl. Table 1, Fig. 4, 5). In contrast, there were no notable changes in the trajectory of urine PCR in the last 6 months in either those who did or did not develop ESRD (online suppl. Table 1, Fig. 6).
Exploratory Analyses
Recognizing that there were baseline differences between the groups that did and not develop ESRD, additional analyses were performed utilizing a non-ESRD comparator group that was matched for baseline characteristics. Using this refined comparator group (n = 670), the overall trajectories of Hb, darbepoetin dose, transferrin saturation, and ferritin were similar to those obtained from the non-ESRD comparator group in the original analyses (online suppl. Table 2).
In the year prior to ESRD/mEOF, 37% of those who developed ESRD and 32% of those who did not (P difference = 0.01) had simultaneously transferrin saturations >30% and ferritin >200 μg/L on at least one occasion. This occurred despite a greater proportion of GI bleeds in the 6 months prior to ESRD/mEOF (19 of the 28 GI bleeding adverse events [68%] in those who developed ESRD versus 19 of the 91 [21%] in those who did not develop ESRD occurred during this period).
Discussion
Our contemporary analytic approach (examining the temporal changes of Hb relative to biomarkers of iron stores, darbepoetin dosing and inflammation) provides incremental knowledge regarding the changes in Hb in individuals with CKD, anemia, and T2DM. We illustrate that these parameters follow markedly different trajectories in participants who did and did not develop ESRD. Specifically, in those who developed ESRD, Hb became progressively lower, despite biochemical measures suggesting iron sufficiency and the administration of increasing darbepoetin doses, while CRP was noted to increase.
The primary regulator of erythrocyte production is EPO, a 34 kDa glycoprotein produced predominantly by renal interstitial fibroblasts, which function primarily to stimulate erythropoiesis in the bone marrow in response to tissue hypoxia [14]. Prior reports indicate that the development of CKD-associated anemia is more likely related to insufficient increases in EPO production, rather than an absolute decline in circulating EPO levels [15]. This relationship provides challenges in the interpretation of EPO levels in CKD-associated anemia and limits their diagnostic utility; therefore, serum EPO levels were not measured as part of the TREAT study.
TREAT also provided an important opportunity to examine trends in Hb in the setting of exogenous administration of EPO derivatives. As expected, our analyses of the active therapy arm indicate that administration of darbepoetin resulted in an increase in Hb during the early phases of treatment. However, as CKD progressed over time, Hb started to decline in those who developed ESRD, and continued to decrease despite escalating doses of darbepoetin. A different pattern was noted in the placebo arm – in participants who developed ESRD, the Hb trajectory was downward from the beginning, and again occurred despite the administration of escalating “rescue” doses of darbepoetin. In contrast, in those who did not develop ESRD, Hb was relatively stable over time. Prior data from our group examined participants in the placebo arm of TREAT, reporting that lower baseline Hb, lower eGFR, and higher proteinuria were the major predictors for requiring ≥5 “rescue” doses of darbepoetin. Furthermore, compared with participants who did not receive any “rescue” doses, those who received ≥5 were more likely to progress to ESRD [16]. Together these findings highlight that, in many cases, administration of increasing doses of darbepoetin (often in excess of 200 μg per month) as ESRD approaches appears to be insufficient to prevent a continued decline in Hb.
The most common reason for hypo-responsiveness to exogenous EPO in CKD patients is iron deficiency, suggested by a serum ferritin concentration <100 μg/L and/or transferrin saturations <20% [17]. Results from NHANES suggest that up to two-thirds of patients with moderate CKD may have insufficient iron stores as defined by these criteria [18]. In our analyses, we noted that serum ferritin increased over time in both those who did and did not develop ESRD, which may partially relate to protocol-driven iron supplementation. However, it was also apparent that ferritin was consistently higher in those who developed ESRD compared with those who did not, which could suggest a greater degree of underlying inflammation. In this regard, it is notable that hepcidin (a major regulator of systemic iron homeostasis via its inhibitory effect on ferroportin), is also upregulated by inflammatory cytokines [19] and could contribute to anemia development. In TREAT, all participants were assessed and treated for iron deficiency according to a predefined study algorithm. Interestingly, we noted a decline in transferrin saturation in the months prior to the development of ESRD that corresponded to a greater observed frequency of GI bleeds in those who developed ESRD (vs. not). However, the overall event rate was relatively small, while overall, a greater proportion of ESRD participants actually met a more stringent biochemical definition of iron sufficiency during this period. However, we recognize that biochemical measures of iron stores may under-diagnosis deficiency at the bone marrow level [20], and therefore we cannot exclude the possibility of a greater prevalence of iron deficiency in these participants.
The presence of inflammation is postulated to be a major risk factor for EPO hypo-responsiveness, with several studies reporting an association with the presence of elevated inflammatory biomarkers [21, 22]. Indeed, prior analyses of TREAT by our group have reported that elevated levels of CRP (>3 mg/L) were present in 48% of participants at baseline [23], and that CRP was marginally higher at baseline in those who had an impaired Hb response to darbepoetin [12]. Our current analyses extend these findings by examining all available CRP measurements during follow-up. We report that CRP concentrations increased markedly in participants who went on to develop ESRD in the months prior to this event, compared with those who did not. Although causality cannot be proved from our data, the temporal relationship with the decline in Hb in those who developed ESRD, in addition to increasing ferritin (also an inflammatory marker), provides additional support for the hypothesis of EPO hypo-responsiveness secondary to the presence of inflammation.
The strengths of this study include the utilization of repeated laboratory measures collected in the setting of a large, randomized controlled trial. Concerns related to potential prescriber bias are limited by the fact that a computer-based dosing algorithm was utilized for all participants. However, there are limitations to our report. Our analyses are primarily descriptive and do not allow for adjustment for potential variables that could potentially alter these measurements over the course of the study. For example, hospitalizations may be more likely to occur in those who developed ESRD, thereby contributing to lower Hb from inpatient stays, while also contributing to missing data from outpatient study visits. The follow-up time for those who did not develop ESRD was truncated in order to be of similar duration to those who developed ESRD. While this may have reduced the overall number of available measurements, truncation ensured that the exposure time captured in both subgroups did not include any fatal events. The progression of secondary hyperparathyroidism or undetected/inadequately treated iron deficiency in those who develop ESRD may contribute to EPO hyporesponsiveness [24], but unfortunately parathyroid hormone and data related to the trajectory of intravenous iron therapy were not available. Similarly, apart from relative EPO insufficiency, other potential contributors to the development of anemia with progressive CKD may relate to the accumulation of as yet unidentified uremic toxin(s). Finally, as this study was performed in participants with CKD, anemia, and T2DM, it is unclear if the results are generalizable to patients without these comorbidities.
In conclusion, we report that Hb declined rapidly in the months prior to the development of ESRD, coincident with a rise in CRP. This pattern occurred in the absence of biochemical measures of iron deficiency and despite escalating doses of darbepoetin. This constellation of findings supports the contribution of an increasing inflammatory state to the pathogenesis of EPO hypo-responsiveness as CKD progresses to ESRD. Incorporation of this analytic approach, which provides additional insight to the temporal changes in biomarkers approaching an event of interest, may help to uncover further pathophysiologic changes that contribute to the progression of CKD.
Disclosure Statement
TREAT was sponsored by Amgen; at that time MAP received grant support from (research grant to Brigham and Women’s Hospital) and served as a consultant to Amgen. No payments in the last 24 months. In addition, MAP has received research support from Novartis and served as a consultant for AstraZeneca, Bayer, Boehringer Ingelheim, DalCor, Genzyme, Gilead, GlaxoSmithKline, Janssen, Lilly, Novartis, Novo Nordisk, Relypsa, Sanofi, Teva, Thrasos. He holds stock options for DalCor and a patent awarded to Brigham and Women’s Hospital regarding the use of inhibitors of the renin-angiotensin system in MI. Licensed by Novartis, Dr. Pfeffer’s share irrevocably assigned to charity. FRMC reports consulting fees from GSK. EAB served as a consultant and advisory board member with Baxter, Fresenius and Abbvie. KUE has received honoraria from Akebia, Bayer, Johnson & Johnson, and grant support from Amgen, Astra Zeneca and Vifor. ASL received grant support (research grant to Tufts Medical Center) from Amgen for his efforts in TREAT. AKS reports consulting fees and research support from GSK and Gillead. SDS reports receiving research support and consulting fees from Amgen and consulting for GSK. RDT reports consulting for Amgen, Akebia, Reata, Boehringer-Ingelheim, Bayer, AstraZeneca and NovoNordisk. PP reports lecture honoraria from Amgen. The other authors report no relevant disclosures.
Financial Disclosure
The TREAT Study was funded by Amgen. This analysis was conducted independently by the authors and they used the data set held at the Brigham and Women’s Hospital; the authors designed and conducted all analyses described herein and were solely responsible for the drafting and editing of this manuscript.
Grant Support
Dr. Finnian R. Mc Causland is supported by the National Institute of Diabetes and Digestive and Kidney Diseases grant K23DK102511.
References
F.R.M.C. and B.C. contributed equally as first-authors.
